Predefined dashboards
The dashboards below showcase the most common metrics that are considered industry standards. These analytics help supervisors and analytics managers make data-driven decisions while handling their day-to-day challenges in the contact center.
You can also create Custom dashboards, which we cover further in the documentation.
The filtering options always stay visible as you scroll down or up any of the analytics tabs. Make sure to glance at them to confirm that you have selected the desired options.
Overview
The most important KPIs and performance metrics of your helpdesk are shown here. Supervisors and Conversations Analytics Managers can get a glance into what is going on with their contact center for the selected period.
You can filter this overview by several parameters:
- Date range: Choose between daily - 7 days is the least you can filter by, monthly, quarterly, yearly, or even all-time analytics.
- Channel Name: Choose if you want all channels or select the specific ones.
- Conversation Queue: Choose which queue you want to see analytics for, or select all.
- Conversation Tag: Filter per specific conversation tags.
- Conversation Form: See how conversations are performing per specific forms your agents are using.
Use this section to analyze each insight or navigate to other dashboards and get to the root of the current issues in your contact center.
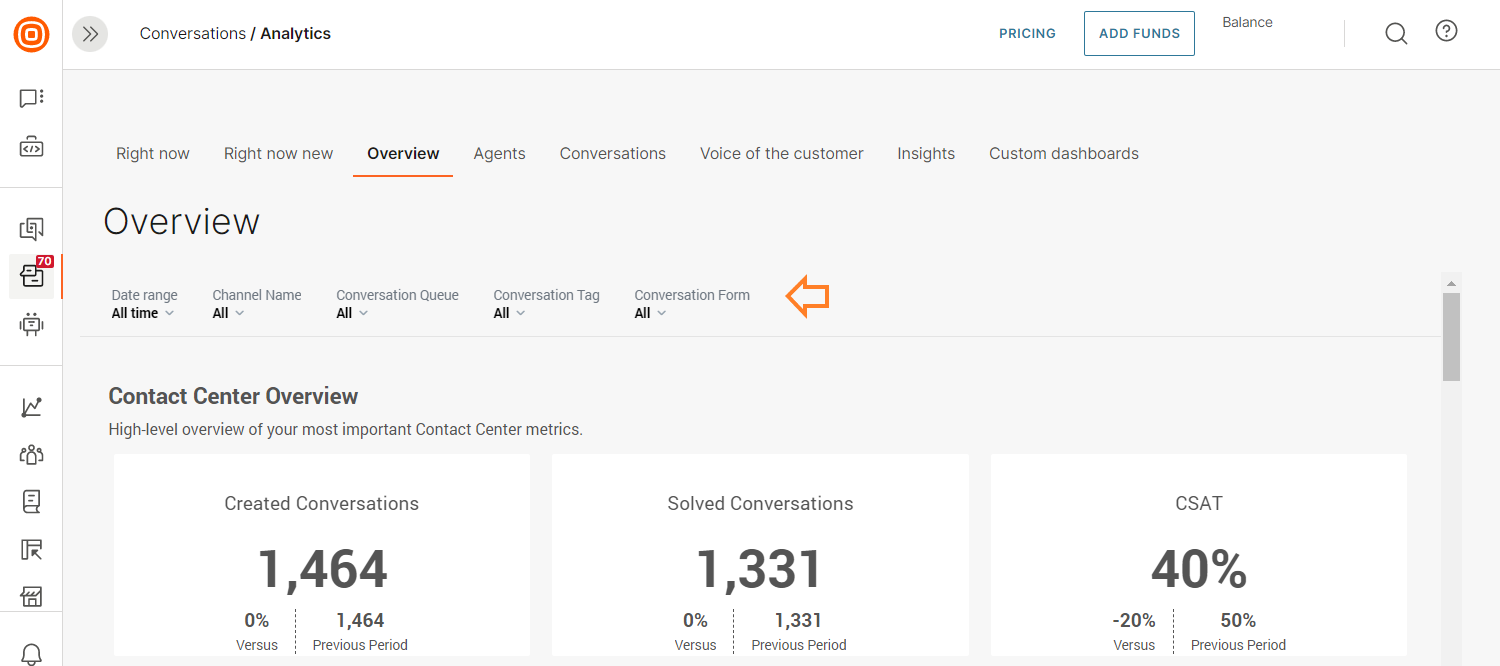
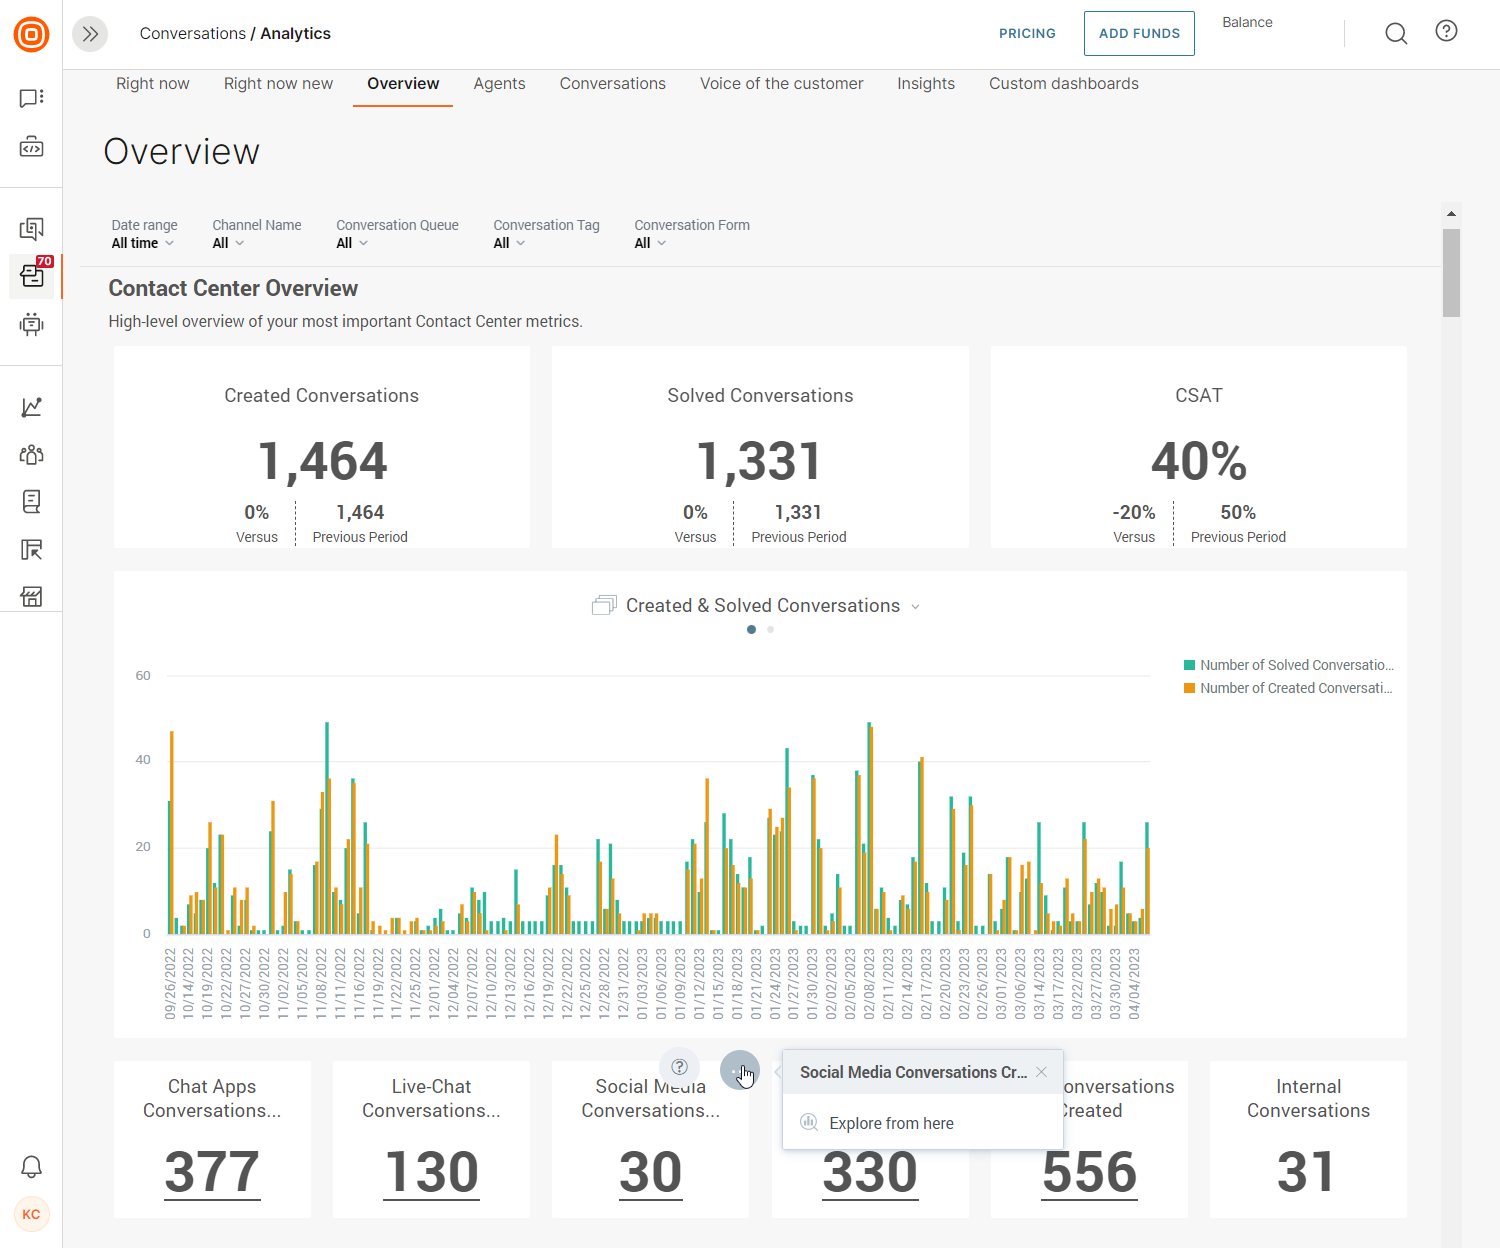
Contact Center Overview
A high-level overview of the most important indicators of your contact center. Here you have an insight into the number of created vs. solved conversations as well as how they are doing compared to the previous period.
Also, this overview provides you with one of the most important metrics - Customer Satisfaction Score (CSAT).
Another interesting overview is that you can see the work distribution per channel category (the number of conversations created per category). You can further explore each of these channel categories to see more details.
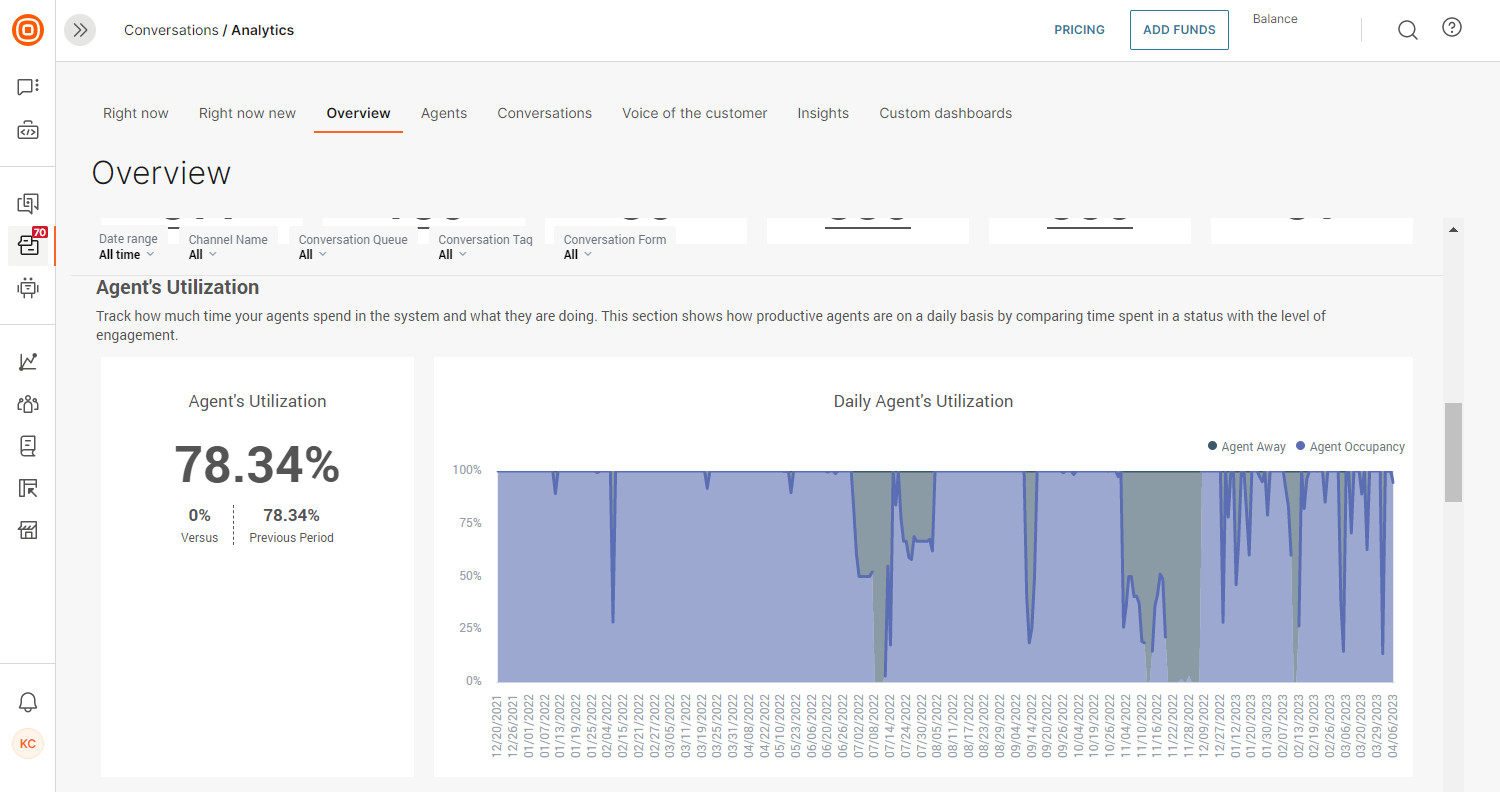
Agent's utilization
Track how much time your agents spend in the system and what they are doing. This section shows how productive agents are on a daily basis by comparing the time spent in a status with the level of engagement.
The metric on the left shows the percentage of time agents spend as Available or Busy out of total logged-in time. The metric on the right shows the ratio of logged-in time agents spent being productive (Available and Busy) versus time spent in an Away status.
You can further expand on both of these and go into detail.
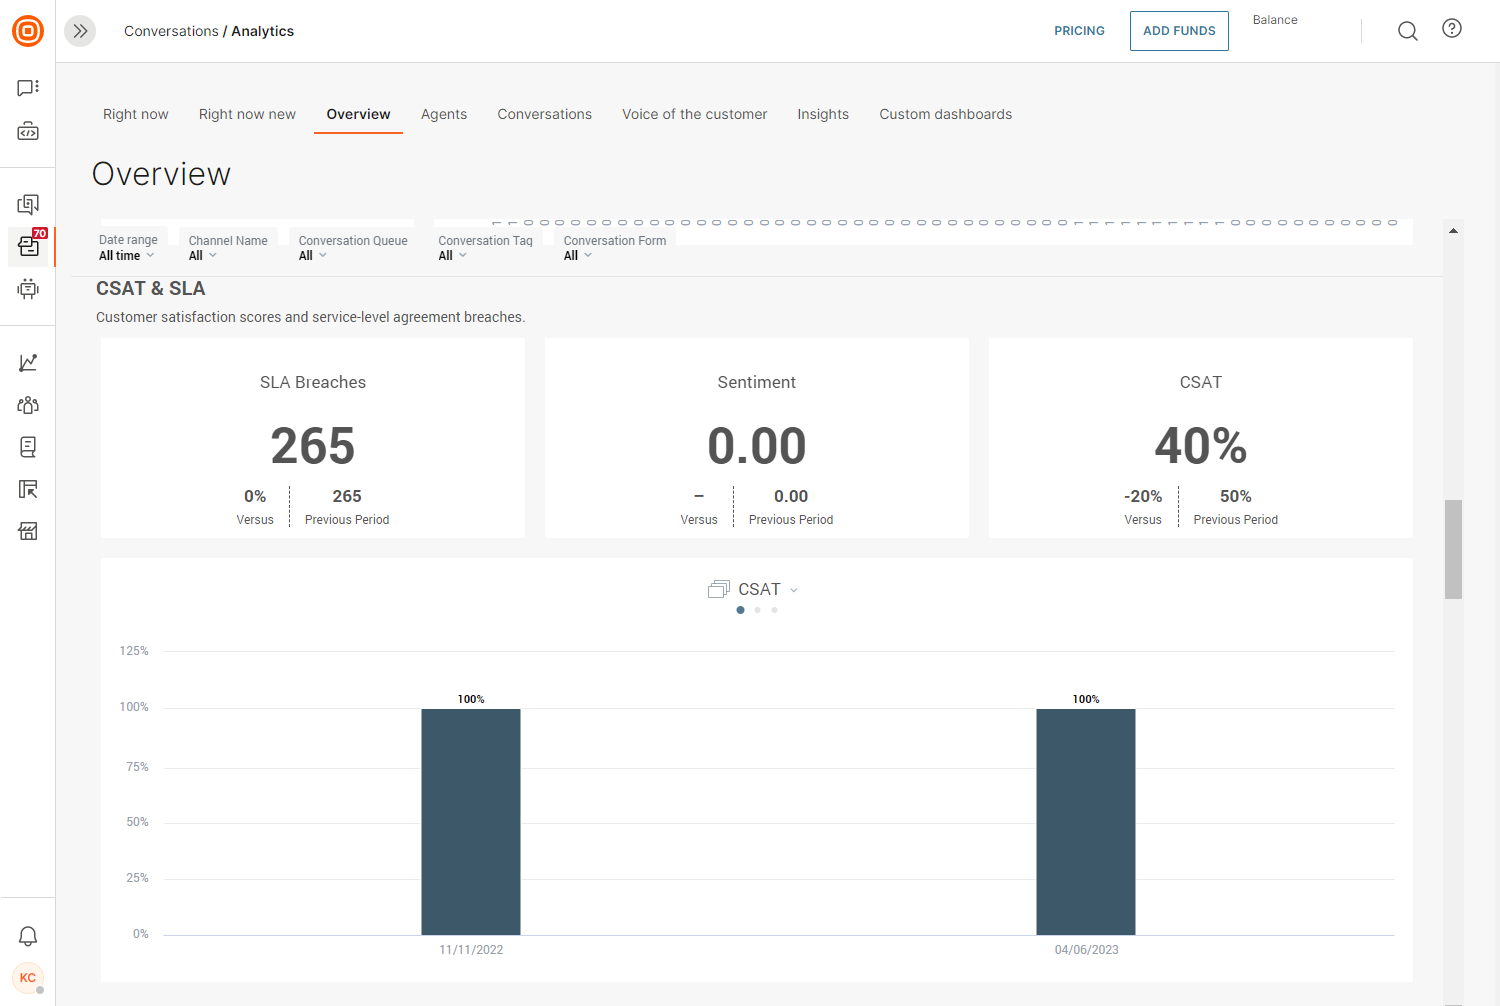
CSAT & SLA
A customer satisfaction score is considered to be the most important indicator of the success of a helpdesk. Combined with the Service-Level Agreement (SLA) numbers, this section provides a powerful insight into the success of your helpdesk.
The first metric shows the number of SLA breaches versus the previous period you have selected.
In the middle, you can see the median sentiment score of all conversations. The sentiment is basically how the system interprets conversations between agents and customers and how the customers are feeling based on what they are communicating to the agents. Sentiment analysis uses machine learning to come up with the score of the conversation.
The metric on the right shows the customer satisfaction percentage of positive survey responses.
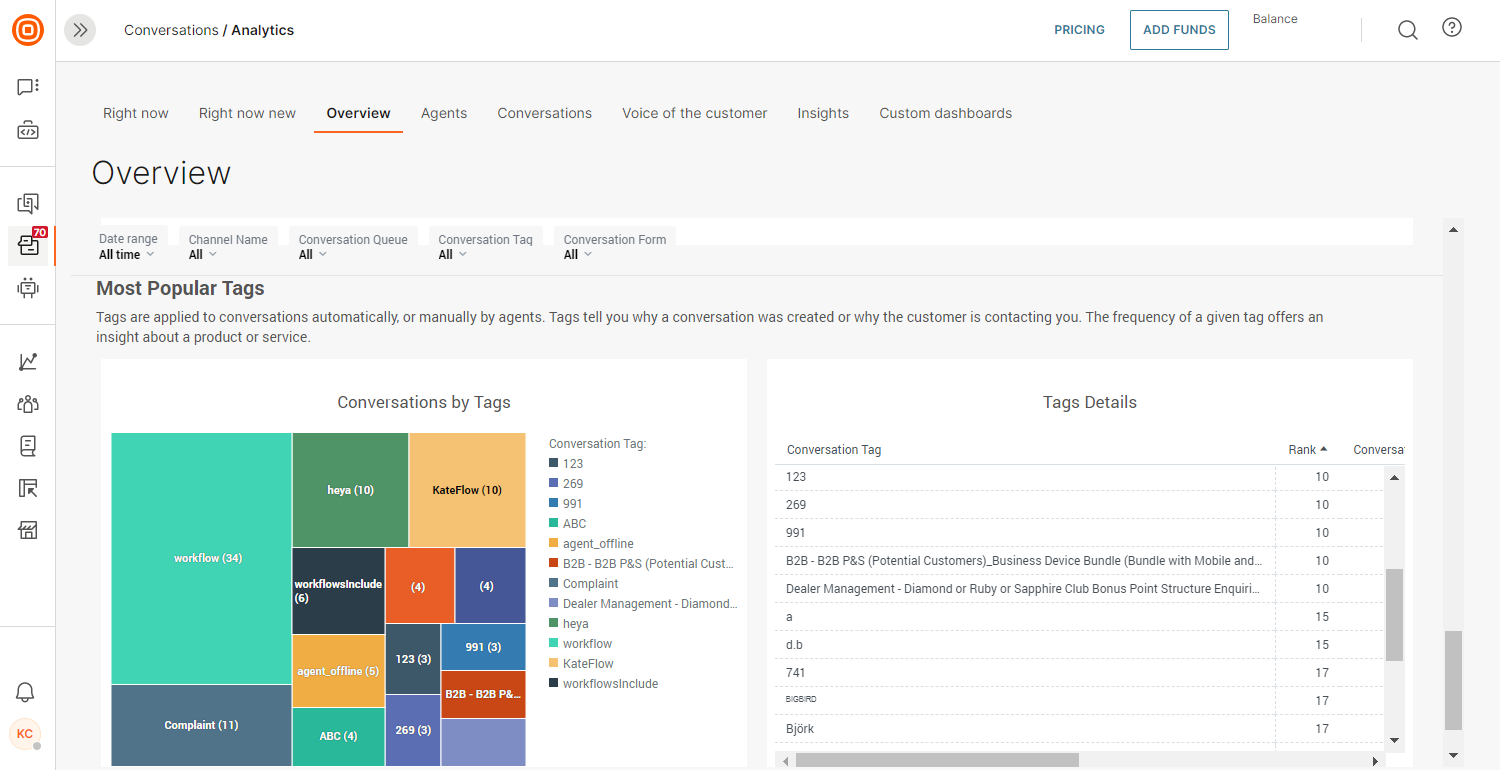
Most Popular Tags
Conversations tags are added to conversations automatically, or agents add them manually. Tags tell you why a conversation was created or why the customer is contacting you. The frequency of a certain tag can provide insight into a product or service and help you decide if you need to make any changes in your contact center.
Use the three-dot button to further expand on the details and performance of each tag.
Channels
The Channels analytics tab provides a full insight into the call center metrics for different channels in use. In this tab, supervisors and Conversations analytics managers can get a detailed insight into how efficient their agents are in call centers.
With this option, you have:
- Insight into the operational performance of queues, agents, and channels
- Reports of every conversation
- Possibility to evaluate and improve the overall customer experience
- Option to meet stated operational and strategic goals
- Identification of issues in operational processes and flows
The Channels tab consists of the following options:
- Live Messaging
- Live Chats
- Inbound Calls
- Outbound Calls
- Transferred Calls
- Callback Calls
Live Messaging
The Live Messaging report offers insights into user engagement metrics, interactions, and activity across various messaging platforms, including:
- Live Messaging applications
- Live Chat
Each category features the same metrics, widgets, and visualizations tailored to the selected channel.
Explore the sections below for further details.
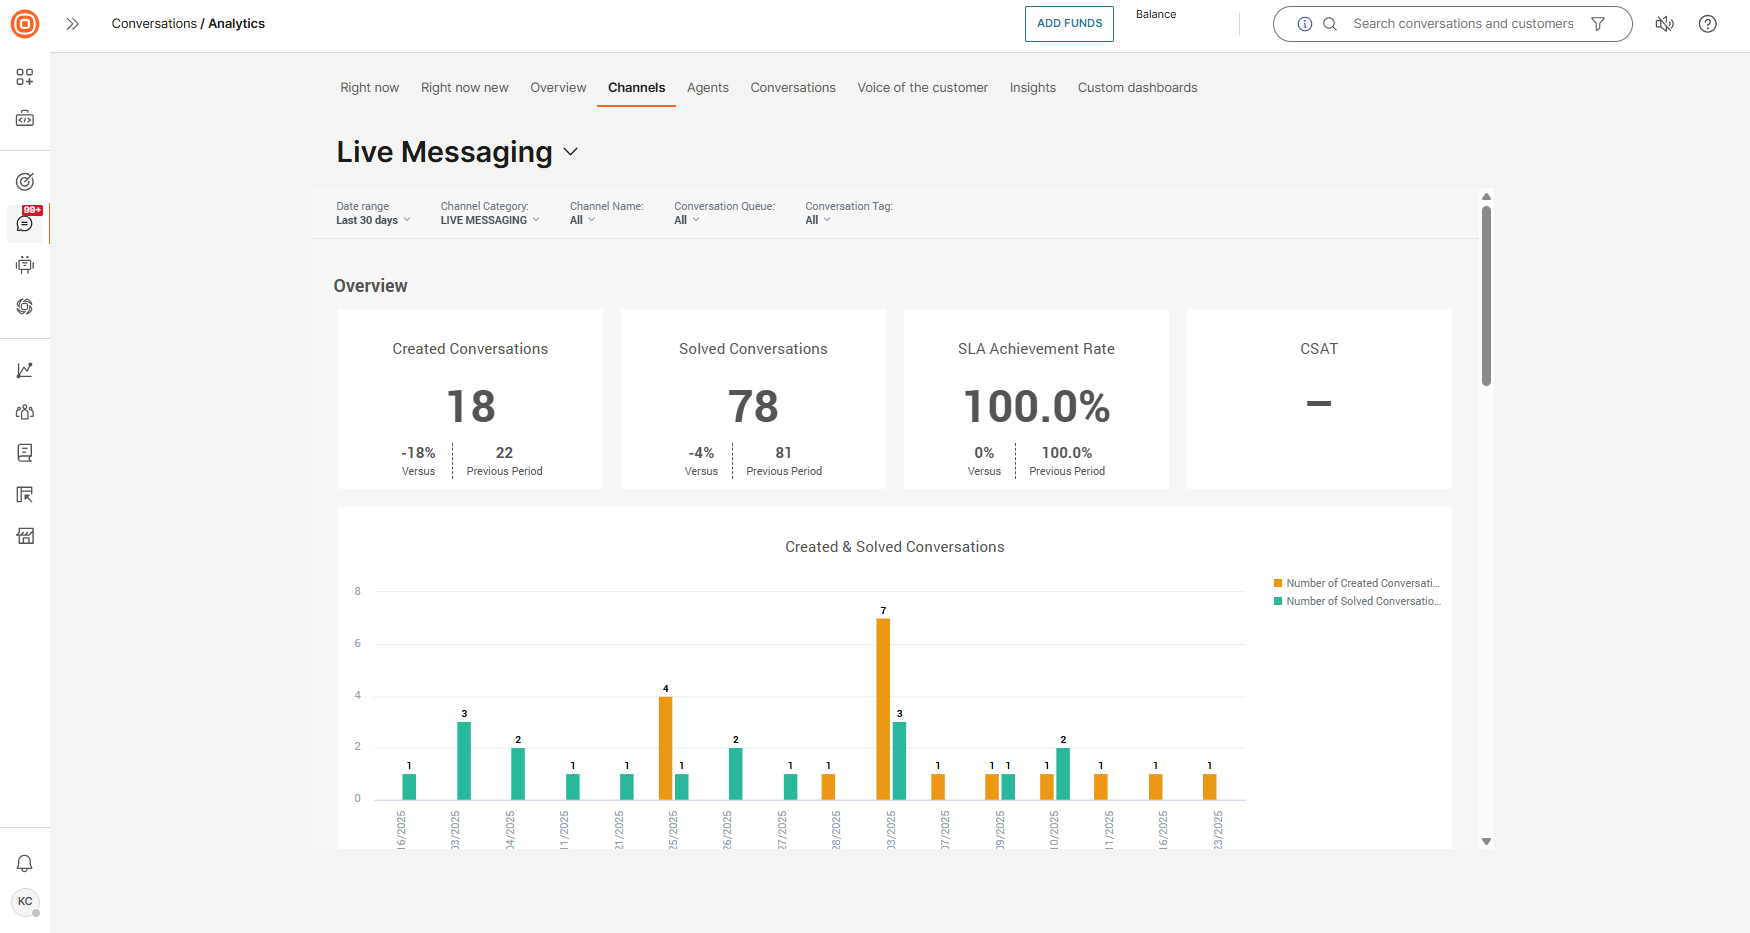
Overview
Shows a brief overview of the following crucial conversation metrics:
- Created Conversations are all conversations created in the selected time range.
- Solved Conversations is the number of all solved or closed conversations in the selected time range.
- SLA Achievement Rate is the percentage of conversations that fulfilled the service-level agreement.
- CSAT is the percentage of positive survey responses.
- Created and Solved Conversations graph displays the ratio between created and solved conversations in a day.
Responsiveness
This metric is used to evaluate the efficiency and quality of communication and customer service within a channel.
- Average First Response Time measures the time from the moment a conversation is created until the first outbound message is sent.
- Average First Response Time vs. CSAT graph shows the percentage of average first response time compared to the CSAT responses.
- Average First Response Time vs. Sentiment graph shows the percentage of average first response time compared to the sentiment score.
- Sentiment displays the median sentiment score.
Performance
The Performance metric provides different insights to assess the channel's efficiency:
- Average Resolution Time calculates the time starting from the beginning of a conversation until its status is updated to either Solved or Closed.
- Average Customer's Messages is the average number of customer messages per conversation.
- Average Agent's Messages is the average number of agent messages per conversation.
- Customer's Messages by Conversations - Total vs. Average graph shows the total number as opposed to the average number of customer messages per conversation.
- Agent's Messages by Conversations - Total vs. Average graph shows the total number as opposed to the average number of agent's messages per conversation.
Conversations details
The Conversations details part is a compilation of filtered conversations containing crucial details, essentially presenting a list of conversations that align with your search parameters.
By selecting any of the Conversation IDs, you can navigate directly to the corresponding conversation within the All Work panel.
The Calls channel has proven to be the most effective way to convey complex topics, and it remains the preferred mode of interaction for a majority of our customers. This emphasizes the importance of acquiring full insights into their experiences. To facilitate this, we provide a dashboard equipped with a range of metrics.
This dashboard encompasses a collection of essential indicators that enable us to not only evaluate customer satisfaction but also enhance operational efficiency within our call center.
Inbound calls
The new dashboard for Inbound Calls is still in development. Changes to the documentation may occur.
Calls are a synchronous and direct channel characterized by minimal wait times and a smooth process. They also demand precise measurements for each step.
There are two major viewpoints on calls:
- Customer's call: From the customer's perspective, the call begins when they dial the number and ends when they hang up, ideally after successfully resolving their issue.
- Agent's call: From the agent's perspective, the call starts when they receive the ringing pop-up on their screen. Agents are busy, and the goal is to track their time precisely, linking their performance to their actions alone.
Everything between the customer dialing your number and the agent resolving the customer's problem is considered part of the call center's performance.
By combining these elements, the time customers spend in the Interactive voice response (IVR) (opens in a new tab) system or queue has been excluded from the agent's performance metrics. These parts of the process are tied to call center-related metrics, while the agent's actions are linked to the agent's performance.
Inbound calls are crucial in boosting customer satisfaction and building lasting relationships, whether through handling inquiries, processing orders, resolving complaints, or providing support.
The Inbound Calls dashboard includes the following filters:
- Date range: Select the time period for which you want to view inbound call data.
- Agent info: Filter metrics based on specific agent details, such as name or ID.
- Conversation queue: Choose the queue to view metrics related to specific conversation queues.
- Conversation tag: Filter metrics by tags related to specific conversations.
- Call type: Select the type of call, such as PSTN or WEBRTC, to refine the data.
- Call direction: This filter is locked to inbound calls, showing only incoming call data.
- Call part type: This filter is locked to initial, displaying only the first part of the call.
This dashboard includes a range of metrics that offer a detailed view of your call center’s performance. Check out the sections below to learn more.
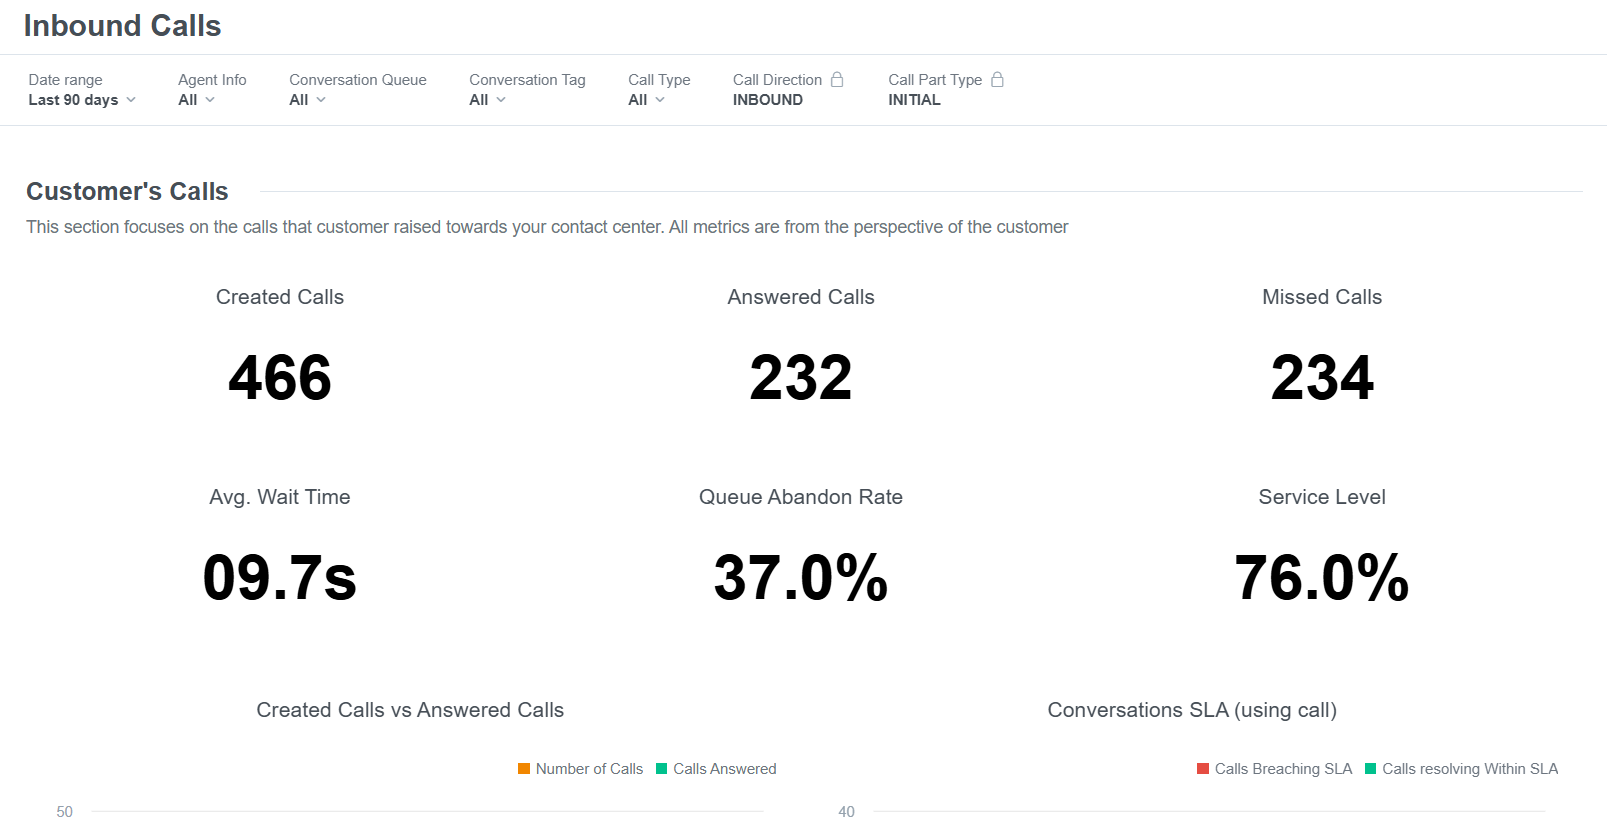
Customer's calls
The Customer's calls metric offers valuable insights into key call metrics, helping you monitor call center performance, make data-driven decisions, and improve customer service. The report includes various metrics related to specific call activities, providing a comprehensive overview of operations.
| Metric | Description |
|---|---|
| Total Inbound Calls | Number of calls that reached the platform. |
| Answered Calls | Number of calls that were picked up (answered) by an agent. |
| Missed Calls | Number of calls not answered, including scenarios such as reaching the waiting strategy time limit, no agent response, callback requests, calls outside working hours, and when auto-assignment is disabled. |
| Average Wait Time | Average time between when a call is offered and when it is answered. |
| Queue Abandon Rate | Percentage of calls abandoned in the queue, excluding calls from queue short abandon. |
| Service Level | Percentage of calls resolved under service-level agreement. |
| Total Inbound Calls vs. Answered Calls | Comparison of the number of inbound calls that reached the platform versus those picked up by an agent over a selected date range. |
| Conversations SLA | Number of calls that met versus breached the service-level agreement within the selected date range. |
| Calls Created Distribution | Number of inbound calls received within a specific time period, visualized by day and hour. |
Agent's calls
The Agent's calls metric offers a detailed analysis of individual agent performance, tracking key metrics related to the calls they handle.
| Metric | Description |
|---|---|
| Calls Rang to Agent | Number of calls that reached the agent, measured when the call rings on the agent's side. |
| Answered Calls | Number of inbound calls picked up by an agent. |
| Ignored Calls | Number of calls where an agent declined the call or did not answer within the ring time period. The call is forwarded to the next available agent. |
| Cancelled by customer | Number of calls that began ringing on the agent’s end but were either canceled by the customer or failed due to a technical issue before being answered. |
| Ignored Calls Breakdown | Comparison between the number of calls actively rejected by agents using the Reject button and those missed due to agents not answering before the ring time expired. |
Performance
The Performance metric provides detailed insights into the call center’s operations, agent performance, and overall call quality. It consists of two main components:
- Average times
- Total times
| Metric | Description |
|---|---|
| Average Handle Time | Average time an agent spends handling calls, including talk time, hold time, and wrap-up time. |
| Total Handle Time | Total time an agent spends handling calls, including talk time, hold time, and wrap-up time. |
| Average Talk Time | Average duration from when a call connects to an agent until it is disconnected, excluding hold time. |
| Total Talk Time | Total time a call remains connected to an agent until it is disconnected, excluding hold time. |
| Average Wrap Up Time | Average time an agent spends in the wrap-up state after a call ends. |
| Total Wrap Up Time | Total time an agent spends in the wrap-up state after handling calls. |
Holds
The Holds metric provides insights into the time callers spend on hold before being connected to a call center agent or during the conversations. It helps analyze hold times, which can be crucial for improving customer experience and optimizing call center operations.
| Metric | Description |
|---|---|
| Average Hold Time | Average time calls were placed on hold by agents. |
| Total Hold Time | Total time calls were placed on hold by agents. |
| Average Hold Per Call | Average number of hold actions used per answered call. |
| Hold Rate | Percentage of answered calls placed on hold at least once. |
Call center - Health check
Abandons
The Abandons metric offers insights and data on abandoned calls, which occur when callers disconnect or hang up before speaking with an agent. This report helps track and analyze such call instances.
| Metric | Description |
|---|---|
| Queue Short Abandon | Number of calls disconnected in less than 7 seconds. |
| Queue Abandon | Number of calls abandoned by the customer before connecting to an agent, excluding those abandoned shortly after entering the queue. |
| Queue Abandon Rate | Percentage of calls abandoned while in the queue, excluding those abandoned shortly after entering the queue. |
| Average Queue Abandon Time | Average time from when a call is offered to when it is abandoned by the customer. |
Performance
The Performance metric provides an overview of your call center's operational health by analyzing key performance indicators. This report highlights areas such as call handling efficiency, agent productivity, and service quality.
| Metric | Description |
|---|---|
| Average Wait Time | Average time from when a call is offered to when it is answered by an agent. |
| Total Wait Time | Total time from when a call is offered to when it is answered by an agent. |
| Average Call Center Resolution Time | Average time from when a conversation is opened to when it is marked as solved. |
| Total Call Center Resolution Time | Total time from when a conversation is opened to when it is marked as solved. |
Failed inbound calls
The Failed inbound calls metric provides insights into calls that could not be successfully connected to an agent. This includes instances where calls were dropped, disconnected due to errors, or failed to reach an agent within the required time. With this, you can identify issues in your call routing or system performance.
| Metric | Description |
|---|---|
| Dropped Calls (before answer) | Number of calls disconnected due to abnormal issues such as operator error, application error, or insufficient funds before the agent answers, resulting in call termination. An error occurred before the customer answered the call. |
| Dropped Calls (after answer) | Number of calls with an abnormal disconnect due to operator error, application error, or insufficient funds after an agent answers. An error occurred after the customer answered the call. |
Call type
The Call type metric categorizes and analyzes the different types of calls handled by your call center.
| Metric | Description |
|---|---|
| Calls distribution per call type | Displays a pie chart showing the distribution of PSTN versus WebRTC call types, based on the Call Type attribute values: PSTN and WEBRTC. |
| WebRTC Audio vs Video | Displays a pie chart showing the ratio of audio to video calls based on the Media Type attribute, including AUDIO, VIDEO, and calls with an empty value assigned to one of the categories based on specific logic. |
| Trend of different call types | Displays a column chart showing the number of calls, or created calls, based on call type over the selected time period. |
Outbound calls
The new dashboard for Outbound calls is still in development. Changes to the documentation may occur.
Outbound calls play a crucial role in addressing consumer inquiries, processing orders, resolving complaints, and providing support, with agents proactively reaching out to customers for various purposes.
The Outbound calls dashboard includes the following filters:
- Date range: Select the time period for which you want to view outbound call data.
- Agent info: Filter calls based on specific agent details, such as name or ID.
- Conversation queue: Choose the queue to view metrics related to specific conversation queues.
- Conversation tag: Filter metrics by tags related to specific conversations.
- Call type: Select the type of call, such as PSTN or WEBRTC, to refine the data.
- Call direction: This filter is locked to outbound calls, showing only outgoing call data.
- Call part type: This filter is locked to initial, displaying only the first part of the call.
This dashboard includes a range of metrics, offering a comprehensive view of your call center's performance. Check out the sections below to learn more.
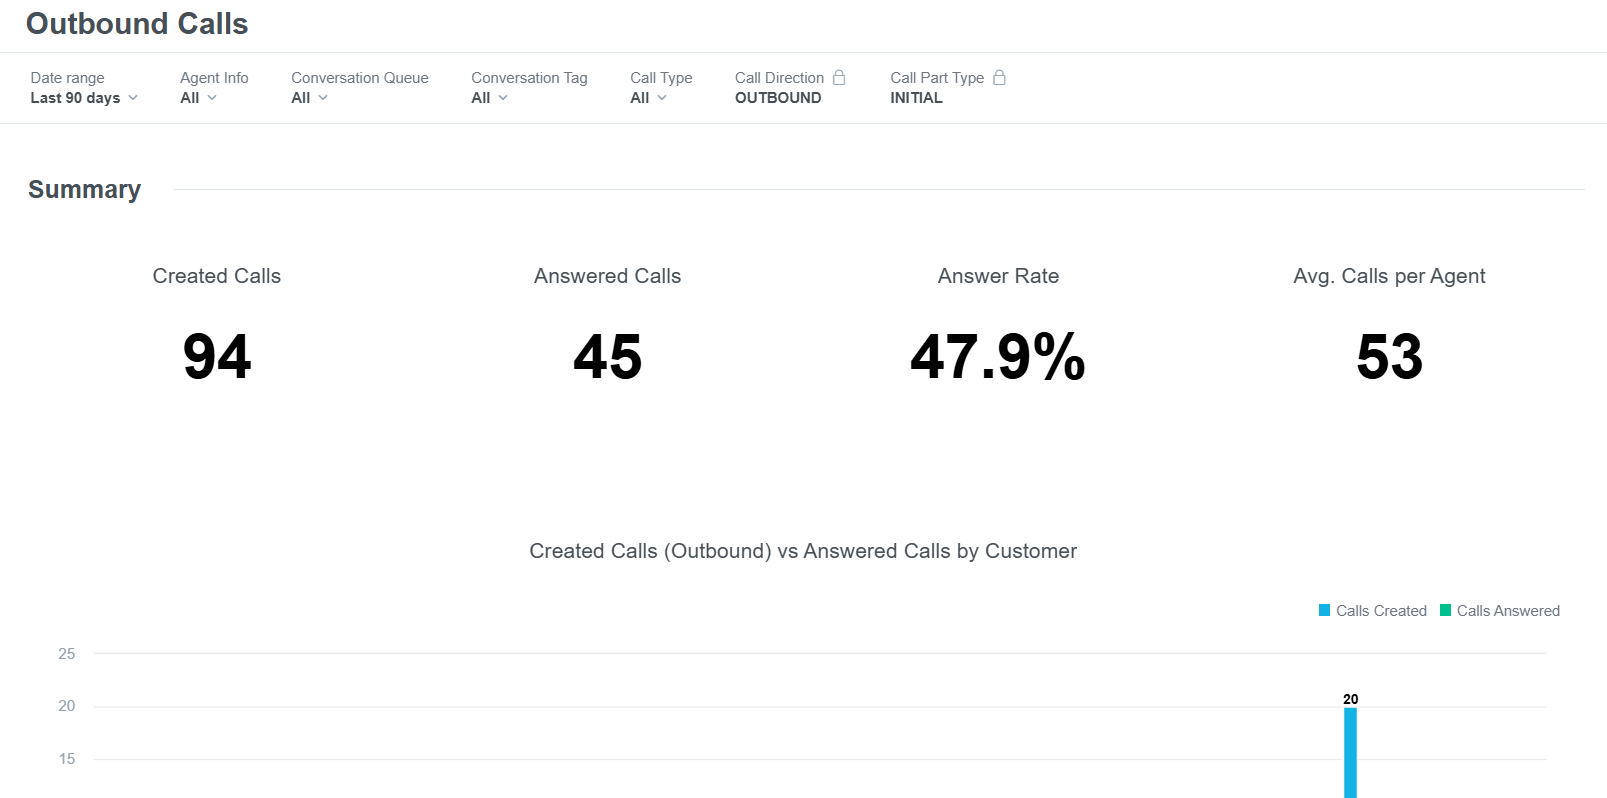
Summary
The Summary metric offers a high-level overview of all outbound calls. It is designed to provide a concise summary of key metrics, allowing you to quickly assess the status and performance of outbound calls.
| Metric | Description |
|---|---|
| Total Outbound Calls | Number of calls initiated from the platform. |
| Answered Calls | Number of calls picked up by the end-user. |
| Answer Rate | Percentage of successfully answered calls. |
| Average Calls per Agent | Shows how many calls, on average, were made by agents who completed at least one call during the selected interval. |
| Created Calls (Outbound) vs Answered Calls by Customer | Comparison of the number of calls initiated from the platform to the number of calls answered by the end-user, based on data from the selected date range. |
Call center health check
Explore the crucial call center metrics to help optimize performance, enhance efficiency, and improve customer satisfaction. By monitoring key indicators, you can identify areas for improvement.
| Metric | Description |
|---|---|
| Calls Created Distribution | Number of calls that were created in a given time period, grouped by day and hour. |
Performance
The Performance metric provides comprehensive insights into the call center's operations, agent performance, and overall call quality. It includes two main components:
- Average times
- Total times
| Metric | Description |
|---|---|
| Average Dial Time | Average time between call creation and call answer. |
| Total Dial Time | Total time between call creation and call answer. |
| Average Talk Time | Average time from when a call is connected to an agent until it is disconnected, excluding hold time. |
| Total Talk Time | Total time from when a call is connected to an agent until it is disconnected, excluding hold time. |
| Average Wrap Up Time | Average time an agent spends in the wrap-up state after a call ends. |
| Total Wrap Up Time | Total time an agent spends in the wrap-up state after a call ends. |
| Average Handle Time | Average time an agent spends handling calls, including talk time, hold time, and wrap-up time. |
| Total Handle Time | Total time an agent spends handling calls, including talk time, hold time, and wrap-up time. |
| Average Call Center Resolution Time | Average time from when a conversation ticket is created to when the conversation is closed. |
| Total Call Center Resolution Time | Total time from when a conversation ticket is created to when the conversation is closed. |
Holds
The Holds metric provides valuable insights into the time agents use the on hold option. This data helps evaluate hold times, which can be crucial for improving efficiency and customer satisfaction.
| Metric | Description |
|---|---|
| Average Hold Time | Average time calls were placed on hold by agents. |
| Total Hold Time | Total time calls were placed on hold by agents. |
| Average Hold per Call | Average number of hold actions performed per answered call. |
| Hold Rate | Percentage of answered calls placed on hold at least once. |
Failed outbound calls
The Failed outbound calls metric tracks instances where outbound calls could not be successfully completed. This includes calls that were disconnected due to errors, failed connections, or issues with the dialing system. With this, you can identify areas for improvement in call routing, agent connectivity, or technical performance.
| Metric | Description |
|---|---|
| Dropped Calls (before answer) | Number of calls that ended due to abnormal disconnects, such as operator errors, application failures, or insufficient funds, before the customer had a chance to answer. |
| Dropped Calls (after answer) | Number of calls that experienced an abnormal disconnect after being answered by the customer, caused by issues such as operator errors, application failures, or insufficient funds, after the customer had a chance to answer. |
Call type
The Call type metric categorizes calls based on their type. This metric provides insights into the distribution of different call types, helping you understand call volumes and tailor your resources and strategies to meet specific customer needs effectively.
| Metric | Description |
|---|---|
| Calls distribution per call type | Displays a pie chart showing different types of calls based on the Call Type attribute values: PSTN and WEBRTC. Empty values are not accepted. |
| Trend of different call types | Displays a pie chart showing different types of calls over a selected date range, based on the Call Type attribute values: PSTN and WEBRTC. Empty values are not accepted. |
Transferred calls
The new dashboard for Transferred calls is still in development. Changes to the documentation may occur.
The Transferred calls dashboard provides an overview of calls that were transferred between agents or departments during customer interactions. It tracks the volume, rate, reasons for transfer, and outcomes, helping identify trends in call handling efficiency and areas for improvement in call routing or agent training.
The Transferred calls dashboard includes the following filters:
- Date range: Select the time period for which you want to view transferred call data.
- Agent info: Filter metrics based on specific agent details, such as name or ID.
- Conversation queue: Choose the queue to view metrics related to specific conversation queues.
- Conversation tag: Filter metrics by tags related to specific conversations.
- Call direction: Select the direction of the call, such as inbound or outbound, to refine the data.
- Call type: Choose the type of call, such as PSTN or WEBRTC, to refine the data.
- Call part type: This filter is locked, displaying only the transferred part of the call.
- Call ID: Filter calls using unique identifiers to view specific call details.
Explore the sections below to discover more about the metrics included in the Transferred Calls dashboard.
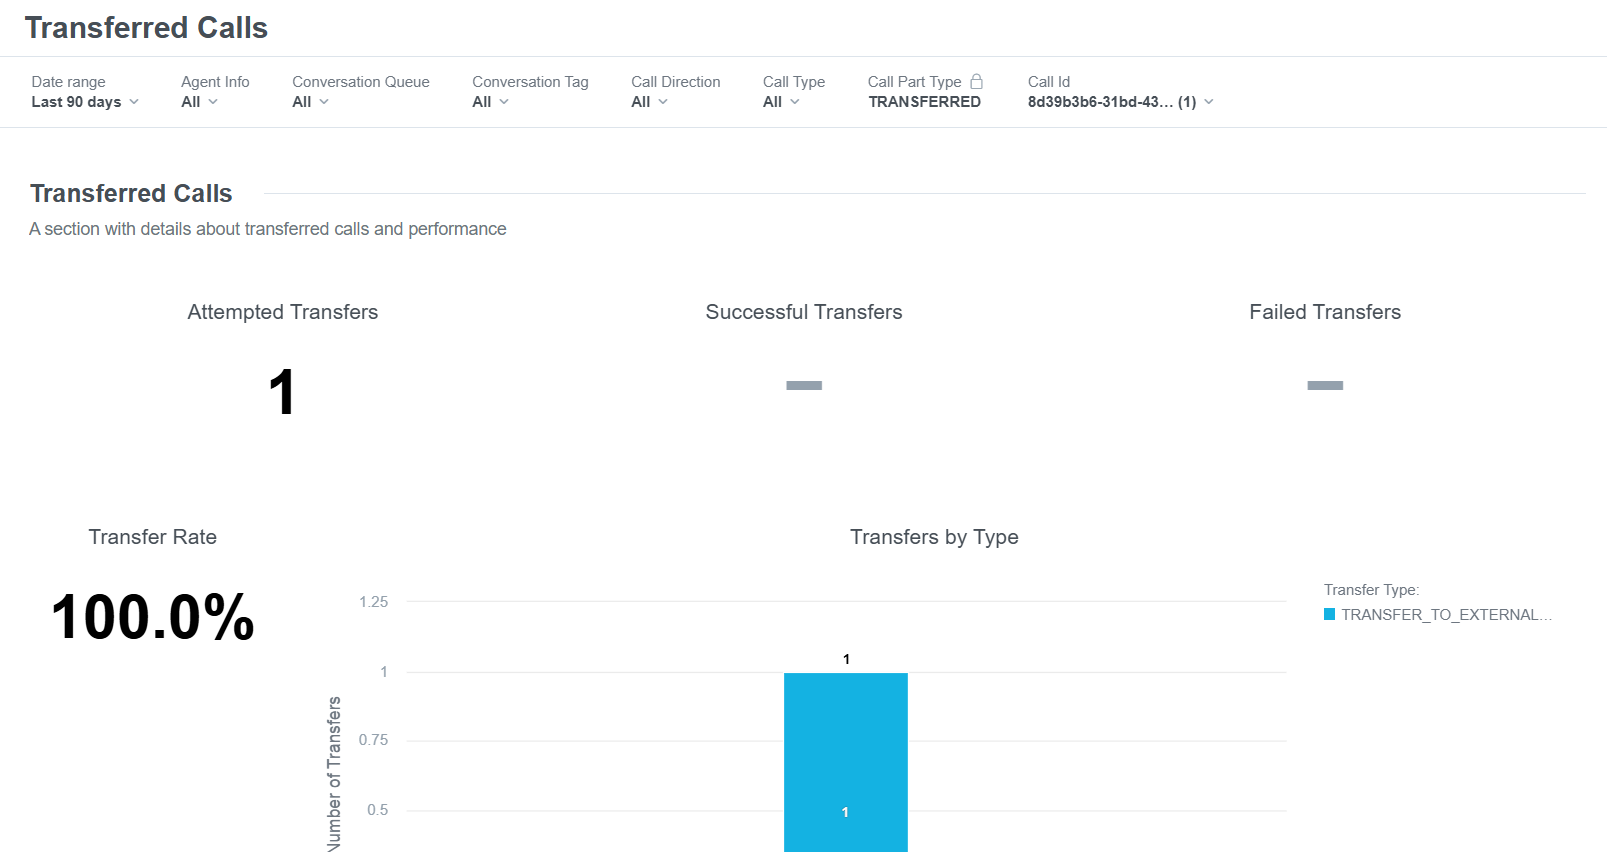
Transferred calls
The Transferred calls metric provides detailed data on calls that were transferred between agents or departments. It tracks the attempted, successful and failed transfers, reasons for transfers, and any associated outcomes.
| Metric | Description |
|---|---|
| Attempted Transfers | Number of transfers made to any destination, including agents, external numbers, or queues. |
| Successful Transfers | Number of transferred calls successfully picked up and answered. |
| Failed Transfers | Number of calls not answered due to reaching the waiting strategy time limit, no agent availability, being outside of working hours, callback requests, or disabled auto-assignment. These calls are terminated without being answered. |
| Transfer Rate | Percentage of calls that were attempted to be transferred. |
| Transfers by Type | Number of call transfers within the selected date range, providing an overview of how often calls are redirected, with amounts shown per day. |
Agent's metrics
Agent's metrics provides a comprehensive analysis of individual agent performance, tracking key indicators such as call ringing time and answer rates.
| Metric | Description |
|---|---|
| Calls Rang to Agent | Number of transferred calls that successfully reached and rang on the matched agent's side. |
| Answered Calls | Number of transferred calls successfully picked up and answered by an agent. |
| Ignored Calls | Number of transferred calls where the agent declined the call or the ring time expired on the agent's side. The call is not terminated, but forwarded to the next available agent. |
| Cancelled by Customer | Number of calls that rang on the agent's side but were canceled by the customer or terminated due to an error before the agent could answer. |
| The separation of Ignored calls | Number of calls that rang on the agent’s side but were either canceled by the customer or failed due to a technical issue before being answered. |
Performance
The Performance metric evaluates an agent’s performance in handling transferred calls, focusing on factors such as waiting, handle, talk, and wrap up time.
| Metric | Description |
|---|---|
| Average Handle Time | Average time an agent spends handling calls, including talk time, hold time, and wrap-up time. |
| Total Handle Time | Total time an agent spends handling calls, including talk time, hold time, and wrap-up time. |
| Average Talk Time | Average time from when a call is connected to an agent until it is disconnected, excluding any time the call was placed on hold. |
| Total Talk Time | Total time from when a call is connected to an agent until it is disconnected, excluding any time the call was placed on hold. |
| Average Wait Time | Average time from when a call is offered to when it is answered by an agent. |
| Total Wait Time | Total time from when a call is offered to when it is answered by an agent. |
| Average Wrap Up Time | Average time an agent spends in the wrap-up state after completing a call. |
| Total Wrap Up Time | Total time an agent spends in the wrap-up state after completing a call. |
Holds
The Holds metric provides valuable insights into the time agents use the on hold option. This data helps evaluate hold times, which can be crucial for improving efficiency and customer satisfaction.
| Metric | Description |
|---|---|
| Average Hold Time | Average time the calls were placed on hold by agents. |
| Total Hold Time | Total time the calls were placed on hold by agents. |
| Average Hold per Call | Average number of hold actions performed per answered call. |
| Hold Rate | Percentage of answered calls placed on hold at least once. |
Failed transferred calls
The Failed transferred calls metric tracks the number of calls that were transferred but could not be successfully completed. It includes instances where the transfer failed due to technical issues, incorrect routing, or the call not reaching the intended agent or destination. This helps you highlight the potential inefficiencies in the transfer process.
| Metric | Description |
|---|---|
| Dropped Calls (before answer) | Number of transferred calls that were disconnected due to abnormal issues such as operator errors, application failures, or insufficient funds before the agent answered the call. |
| Dropped Calls (after answer) | Number of transferred calls that were disconnected due to abnormal issues, such as operator errors, application failures, or insufficient funds, after the agent answered the call. |
Callback calls
The new dashboard for Callback calls is still in development. Changes to the documentation may occur.
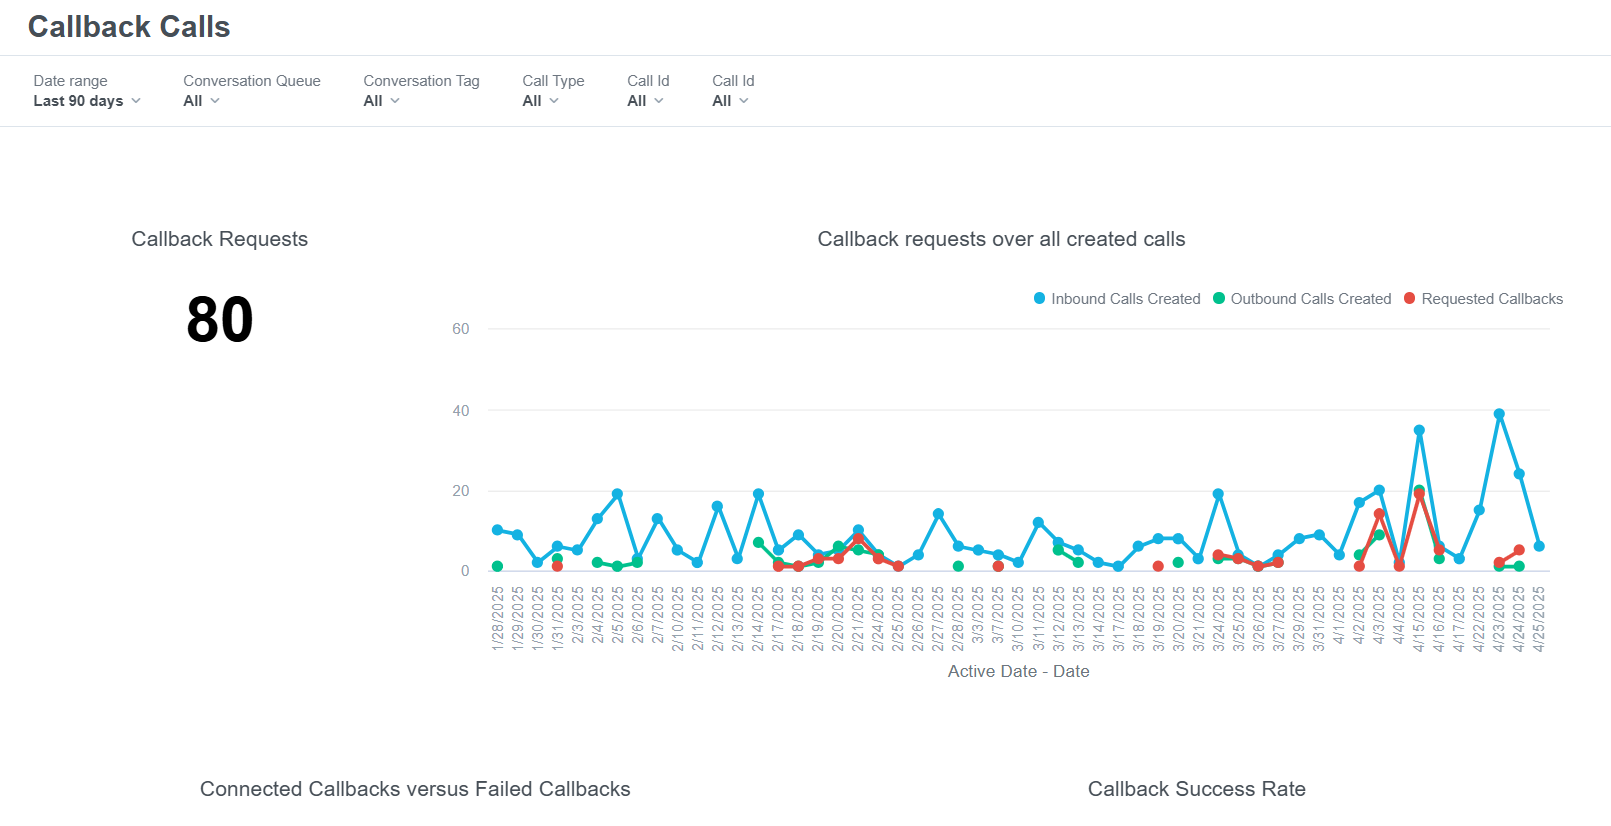
The Callback calls dashboard measures the effectiveness and efficiency of a call center's callback service. In a callback system, customers can opt to leave their contact information and request a callback instead of waiting on hold, ensuring they are contacted by an agent when it is their turn in the queue.
The Callback calls dashboard includes the following filters:
- Date range: Select the time period for which you want to view callback call data.
- Conversation queue: Choose the queue to view metrics related to specific conversation queues.
- Conversation tag: Filter metrics by tags related to specific conversations.
- Call type: Select the type of call, such as PSTN or WEBRTC, to refine the data.
- Call ID: Filter calls using unique identifiers to view specific call details.
Explore the table below to discover more about the metrics in the Callback Calls dashboard.
| Metric | Description |
|---|---|
| Callback Requests | Number of calls where customers requested a callback, including instances with multiple consecutive requests before the agent connected with the customer. |
| Callback requests over all created calls | Callback requests made by customers during inbound calls and/or outbound calls. Provides insights into customer preferences for callbacks. |
| Connected Callbacks vs Failed Callbacks | Displays a chart comparing the number of callbacks successfully connected to customers with those that failed to be established. |
| Callback Success Rate | Percentage of callback requests successfully handled, where a call was established between the agent and the end-user. |
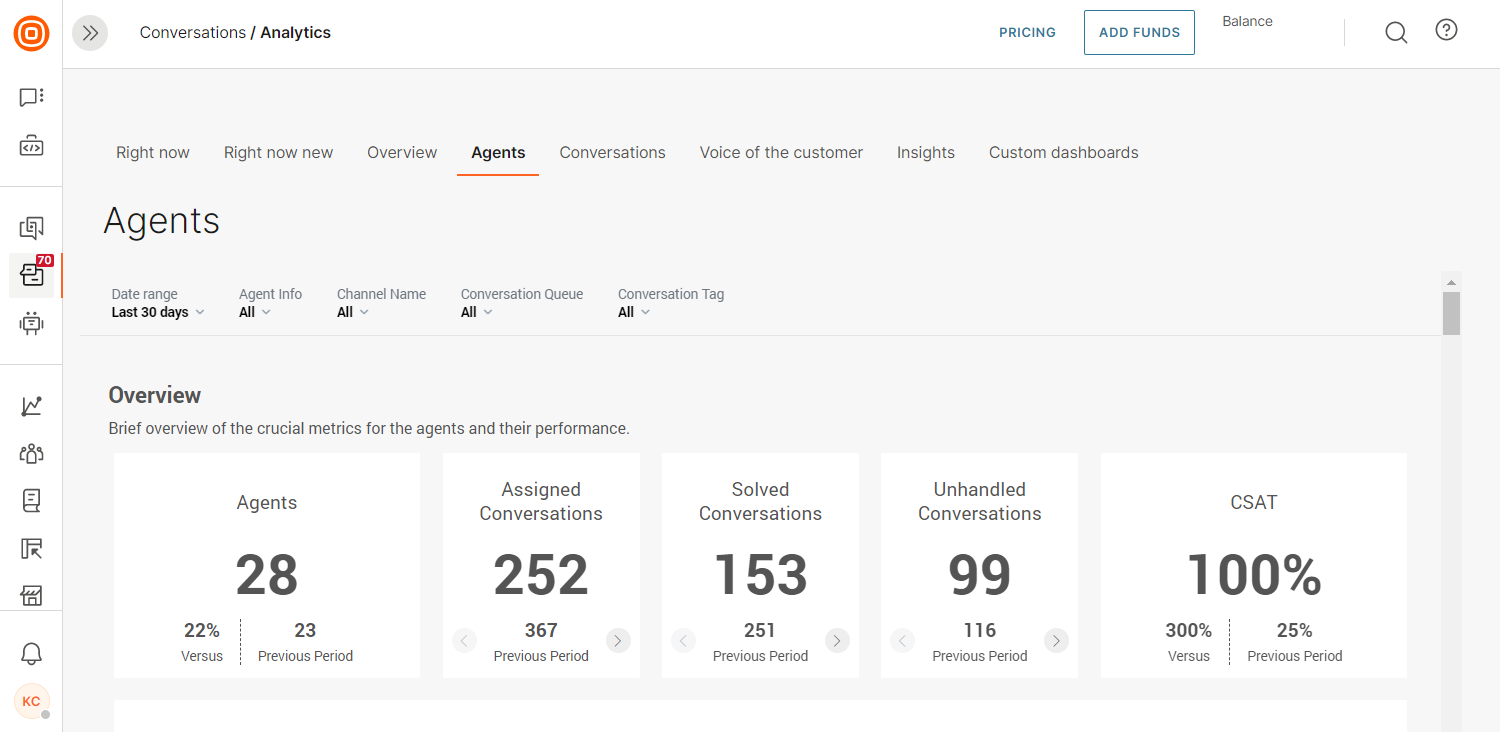
Agents
The Agents analytics tab is the central place to check the performance of all your agents, the number of conversations they are handling, the number of customers they are serving, their responsiveness, and utilization.
You can filter the data based on your desired criteria:
- Date range
- Agent info
- Channel name
- Conversation queue
- Conversations tag
Overview
Shows a brief overview of the crucial metrics for the agents and their performance.
Here you can see the number of agents actively working on conversations based on your filter criteria. Also, you can see the number of offered, solved, and unhandled conversations, as well as the CSAT.
Agents overview
Shows a list of agents who are actively working on conversations (based on your search criteria). You can further expand on this or export the list by clicking on the three-dot button on the far right side.
Here you can see the number of conversations (offered, solved, unhandled), the number of customers served, the average first response time and average resolution time, plus the CSAT.
Responsiveness
This section provides info about how responsive your agents are, how fast and efficient they are in resolving incoming inquiries, as well as the top and bottom-performing agents.
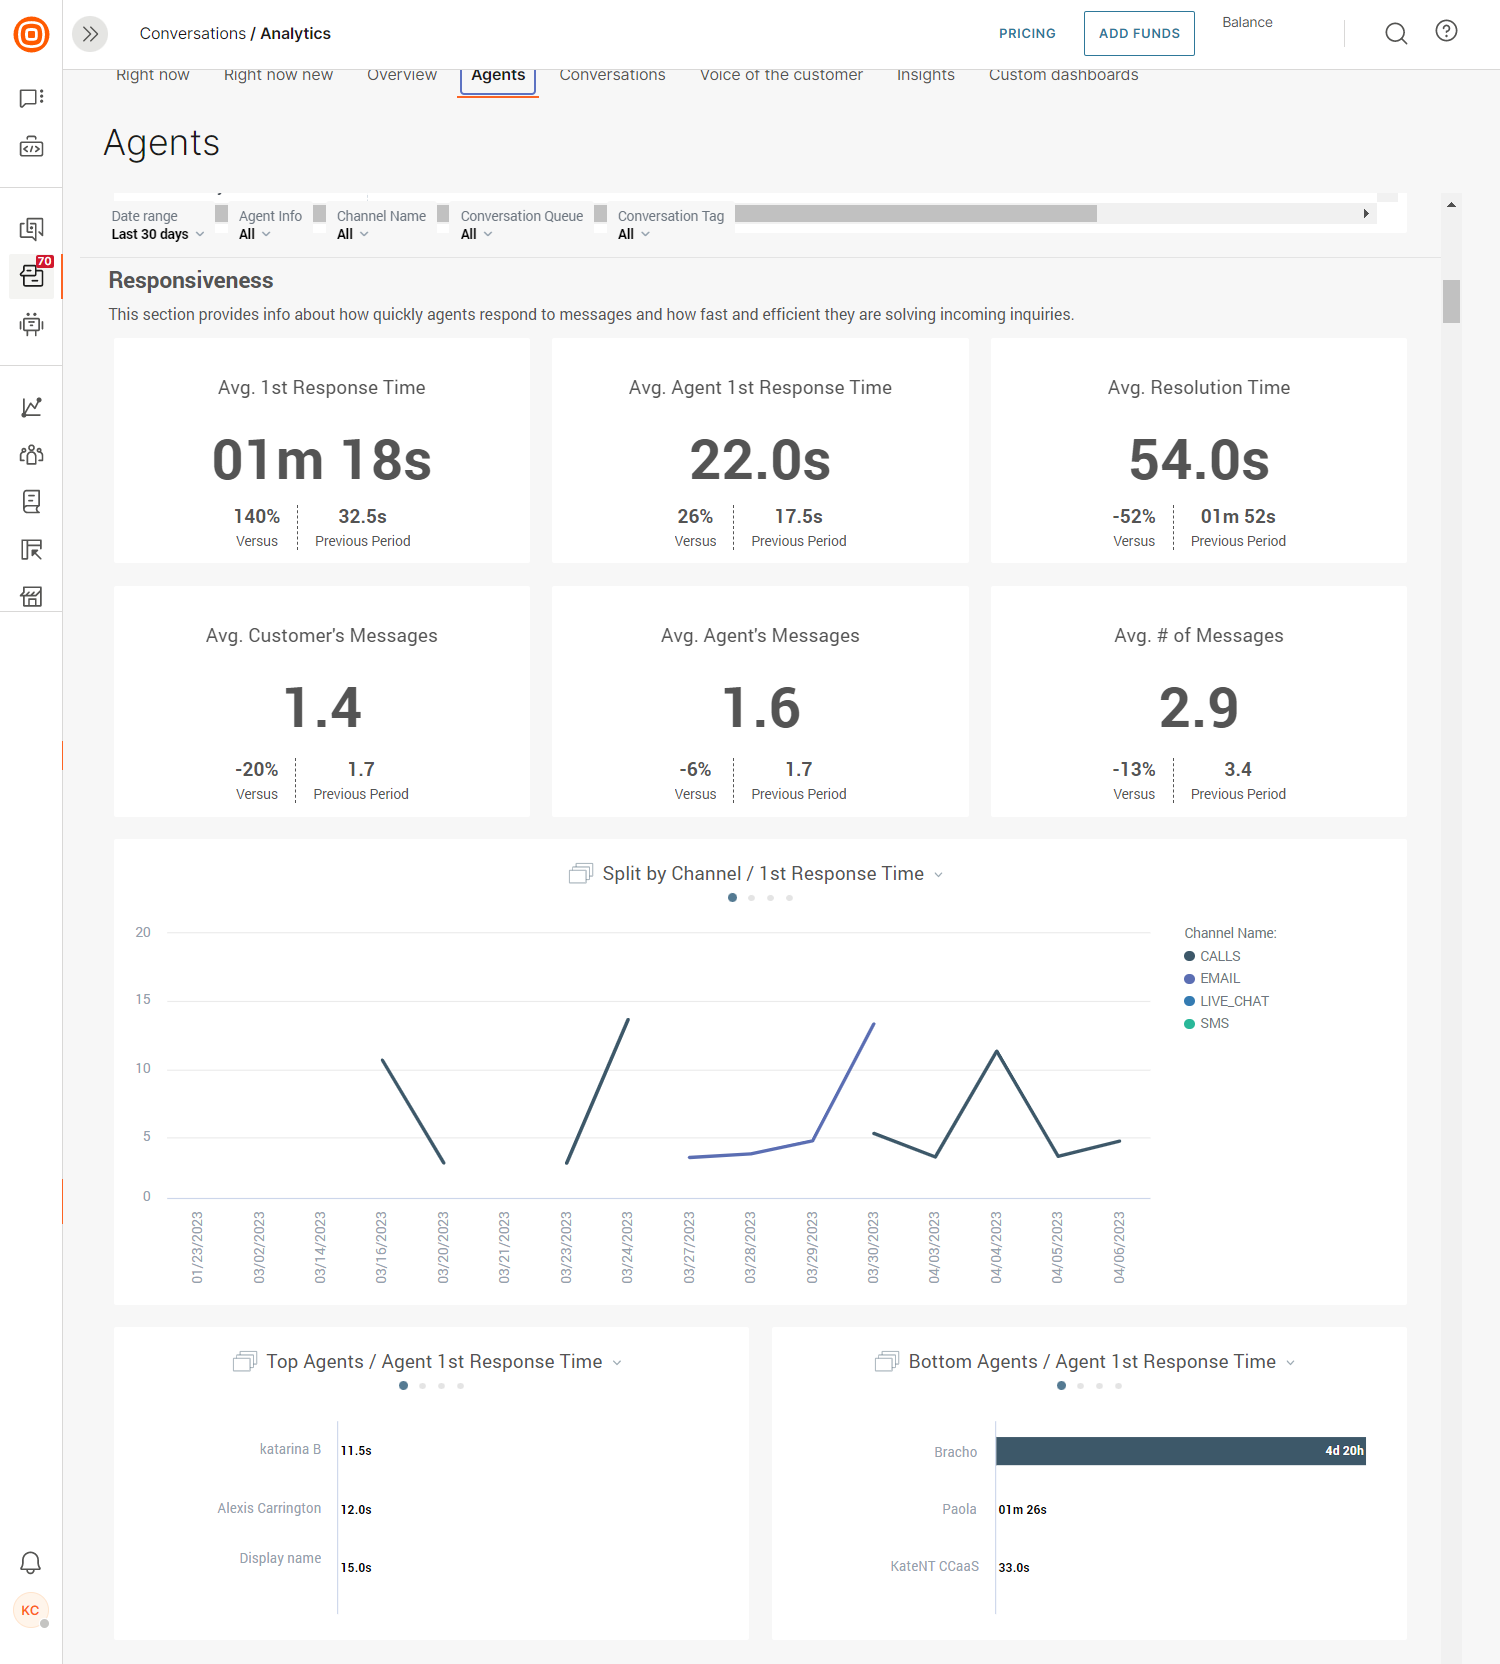
Looking from left to right, the very first insight shows the average first response time. This time is measured from the time a conversation is created until the time an agent sends the first message.
The third insight here shows the average resolution time. This time is measured from the start of a conversation until its status is changed to Solved or Closed.
The fourth insight here shows the average number of customer messages per single conversation, while the fifth insight displays the number of agent messages per single conversation.
The last insight displays the average number of messages exchanged between agents and customers.
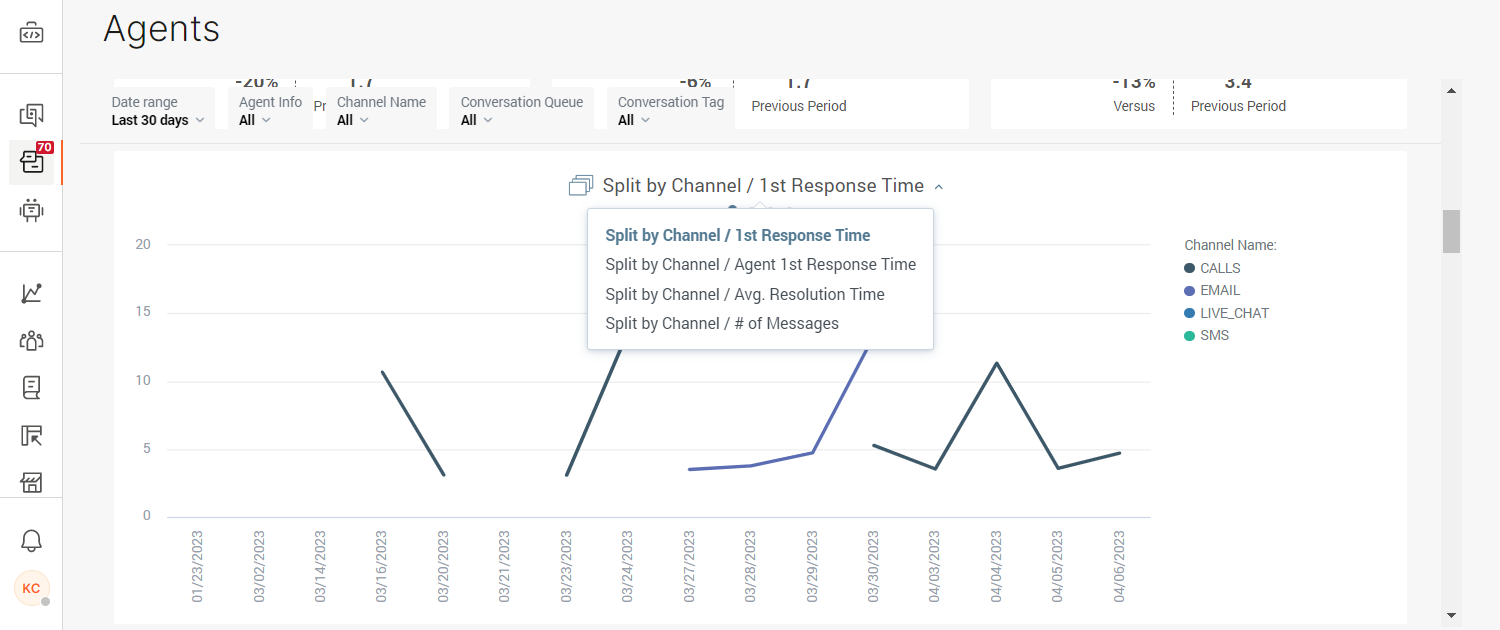
Below these, you will find an insight that shows a few metrics performing per channel:
- 1st Response Time
- Agent 1st Response Time
- Average Resolution Time
- Number of Messages
The first response time counts the whole time from the creation of the conversation until the agent has replied.
Example: A new conversation was created on 2022/10/24 at 07:32:20, and the agent replied on 2022/10/24 at 15:27:20. The first response time here is 07h 55m.
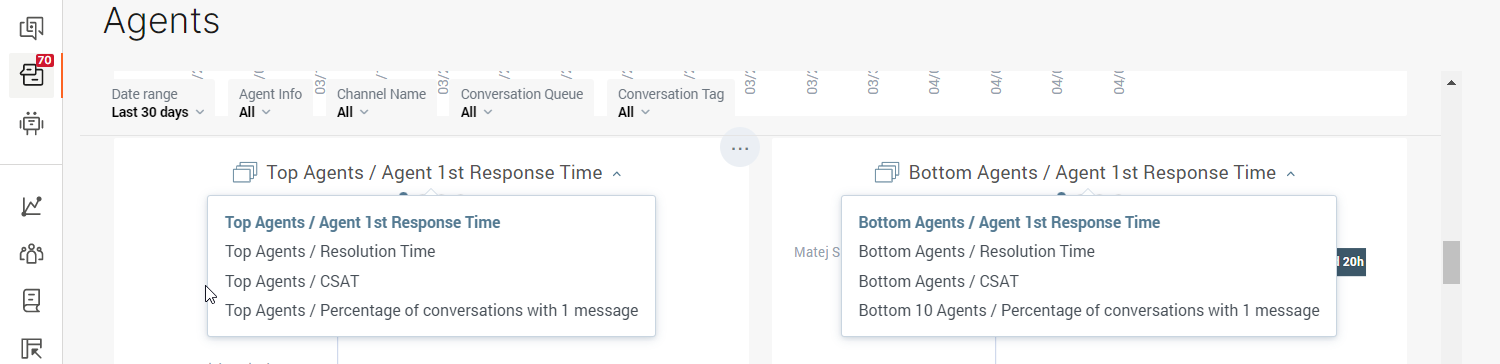
The next two insights represent the top and bottom-performing agents based on these metrics:
- Agent 1st Response Time
- Resolution time
- CSAT
- Percentage of conversations with 1 message
Here you can determine if you need to talk to any of your agents regarding their performance as these metrics will show the true state of your entire agent workforce.
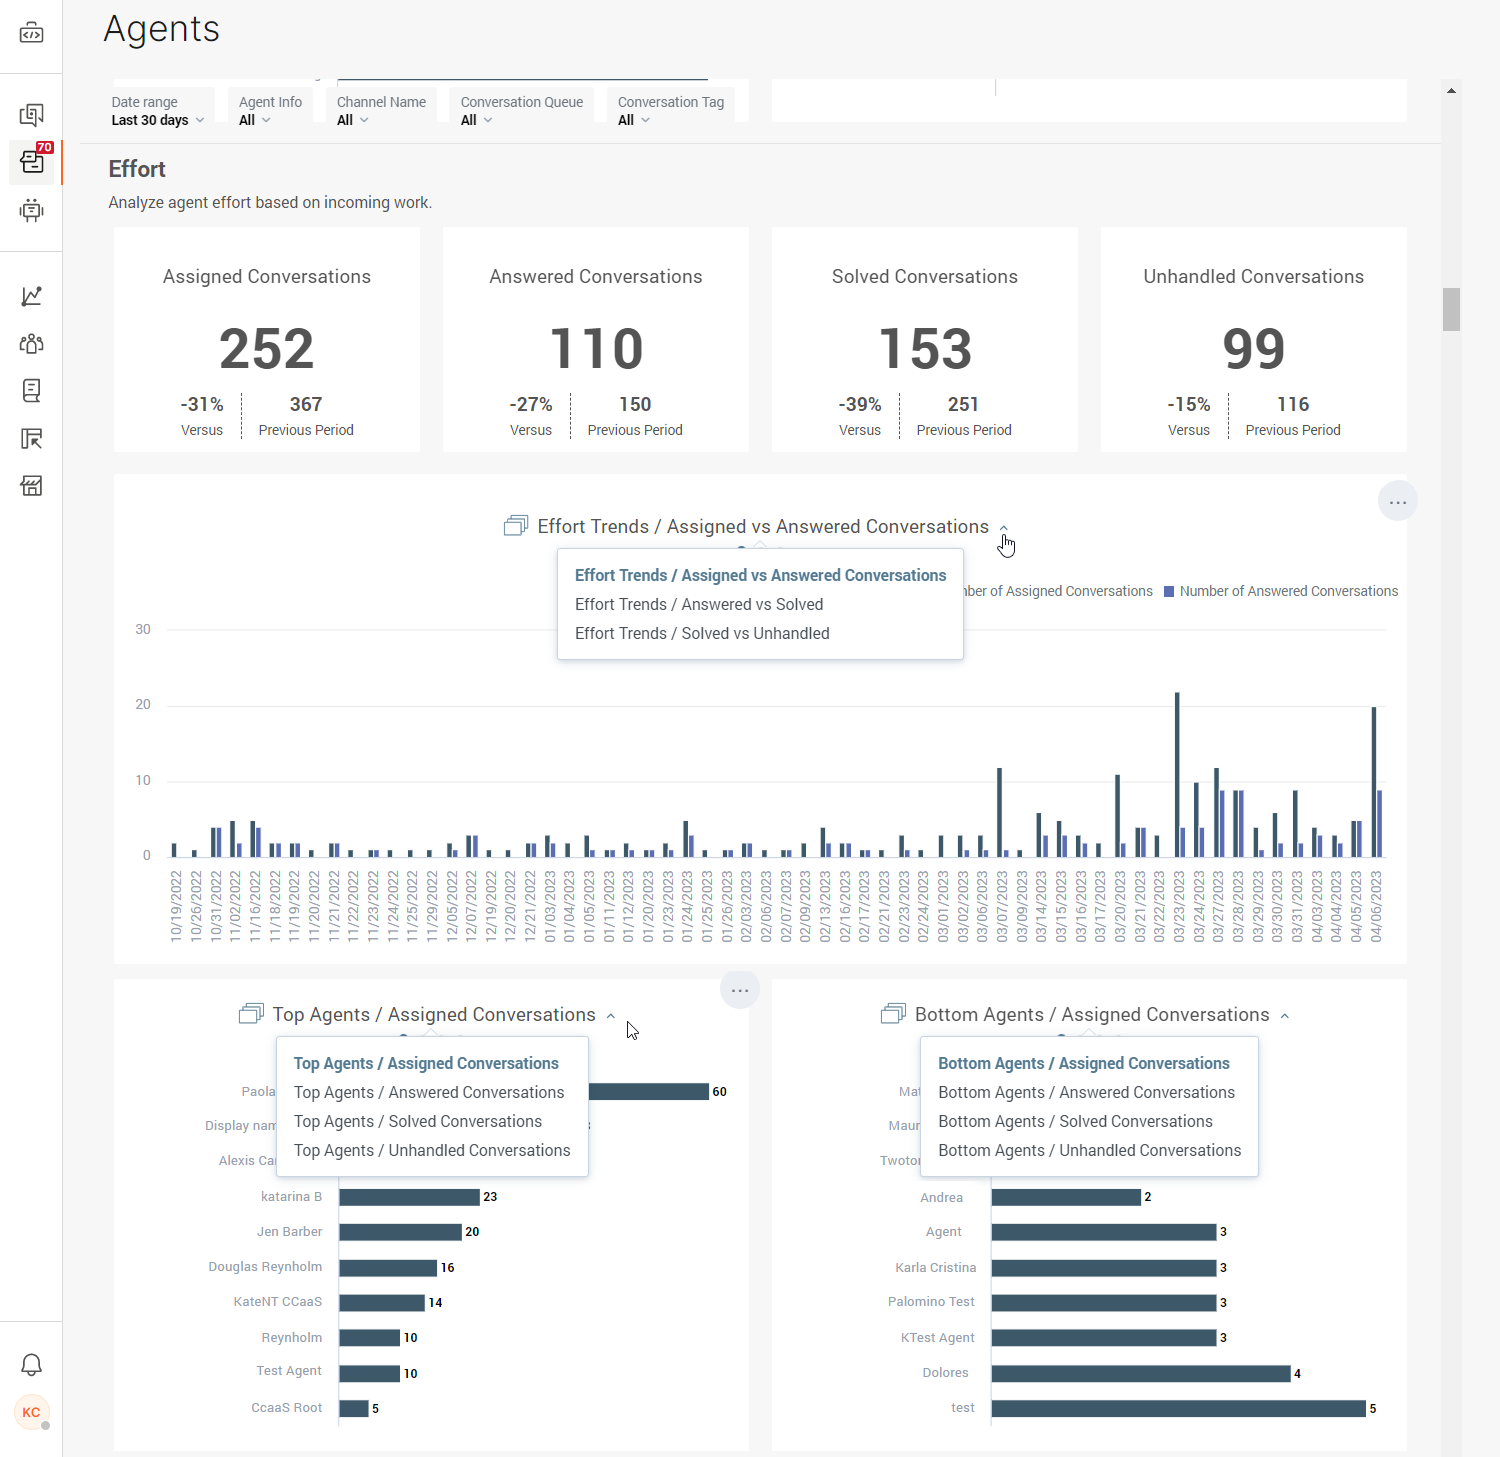
Effort
Analyze your agents' efforts based on the incoming workload.
In this section, you can see the number of offered, answered, solved, and unhandled conversations based on the selected time period.
Furthermore, you can drill down to effort trends and see a comparison graph between:
- Assigned vs. Answered Conversations
- Answered vs. Solved
- Solved vs. Unhandled
The last insight under efforts gives you an overview of top and bottom-performing agents per any one of these criteria:
- Assigned Conversations
- Answered Conversations
- Solved Conversations
- Unhandled Conversations
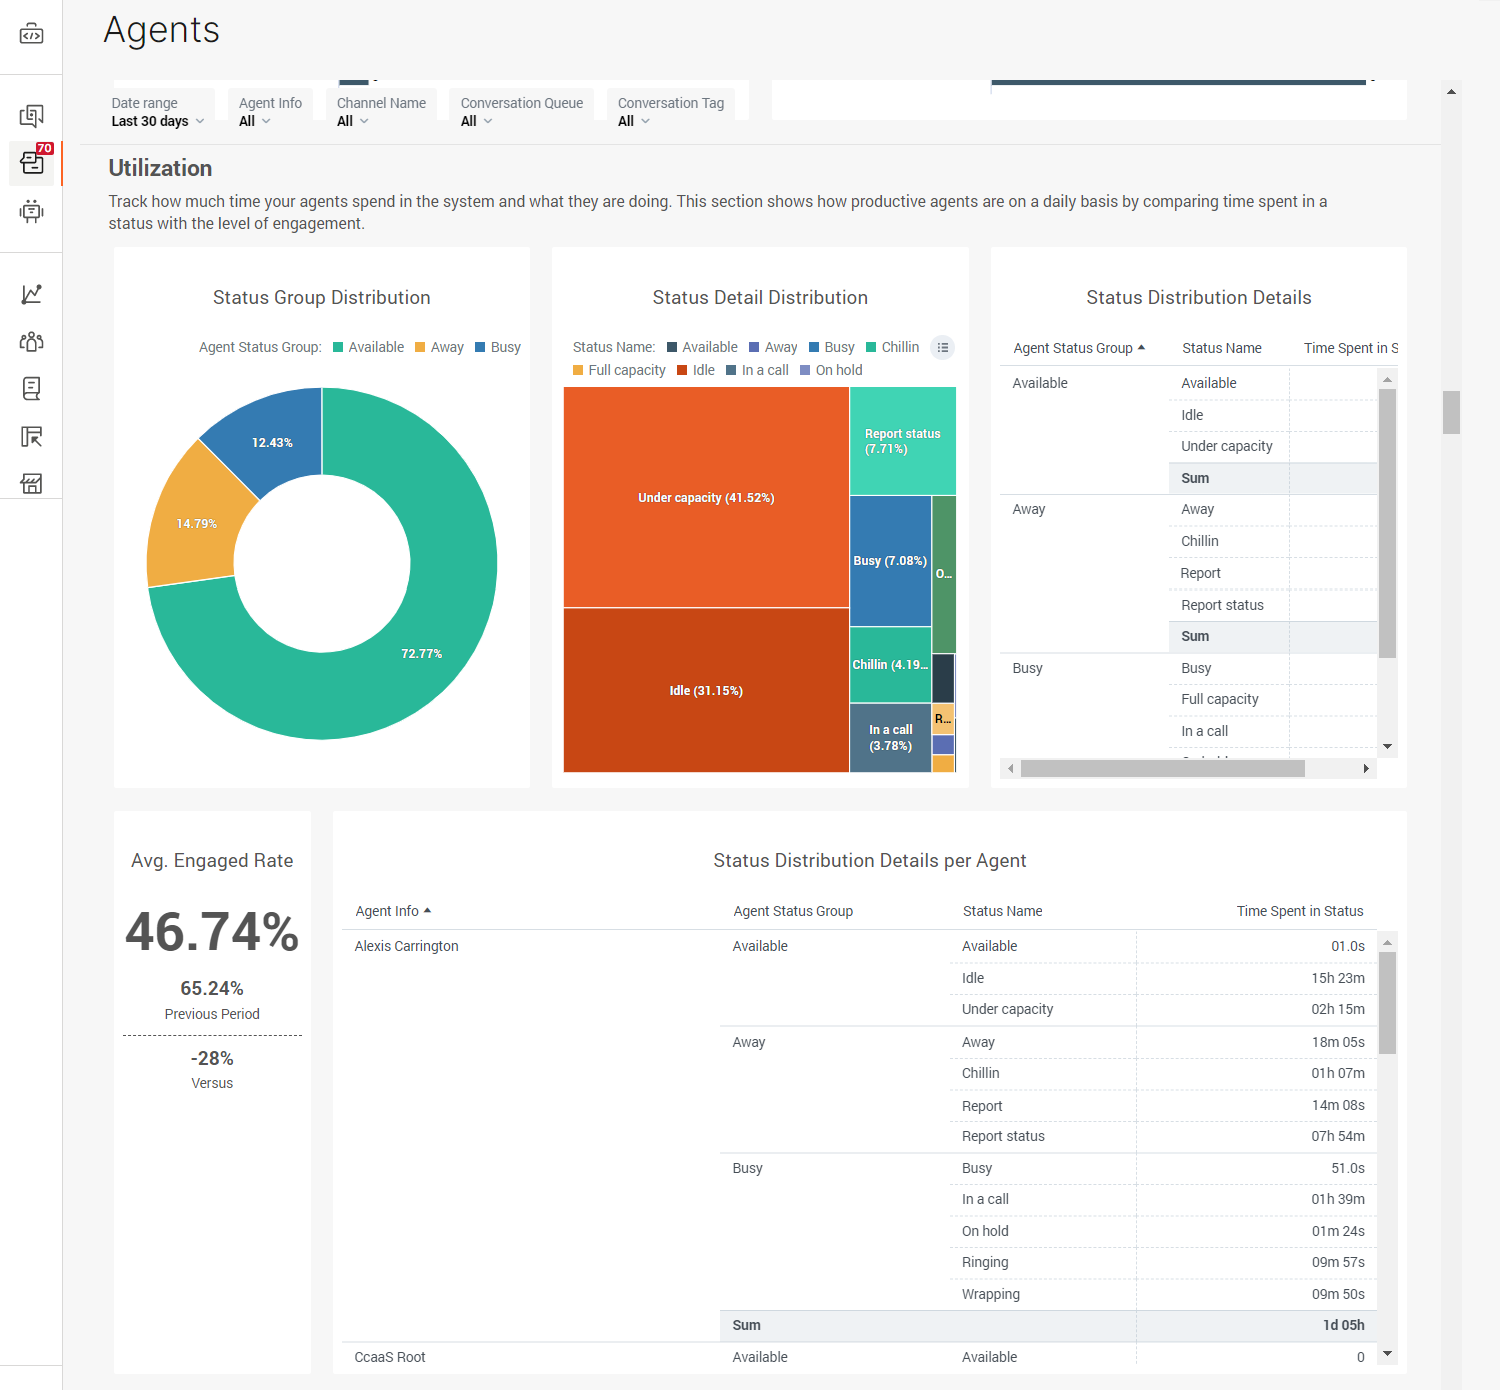
Utilization
These analytics provide insight into how much time your agents spend in the system and what they are doing. Check out how productive your agents are on a daily basis by comparing time spent in a particular status with the level of engagement.
The Status Group Distribution insight showcases the percentage of their time spent per status group. You can click on any of the groups to view details. The Status Detail Distribution goes further into detail and displays the percentage your agents have spent in each status.
By default, all statuses are displayed on the graph. You need to click on the status name to exclude it from the graph or click on it once again to include it.
The Status Distribution Details insight shows the total agent time spent in each status group (and in each status). To view this data per individual agent, check out the Status Distribution Details per Agent just below this one.
Average Engaged Rate is the time agents spend in status in which they actively interact with customers. These are the statuses that count toward this metric:
- Full capacity
- Full capacity (mobile)
- In a call
- Ringing
- Under capacity
- Under capacity (mobile)
- Wrapping up
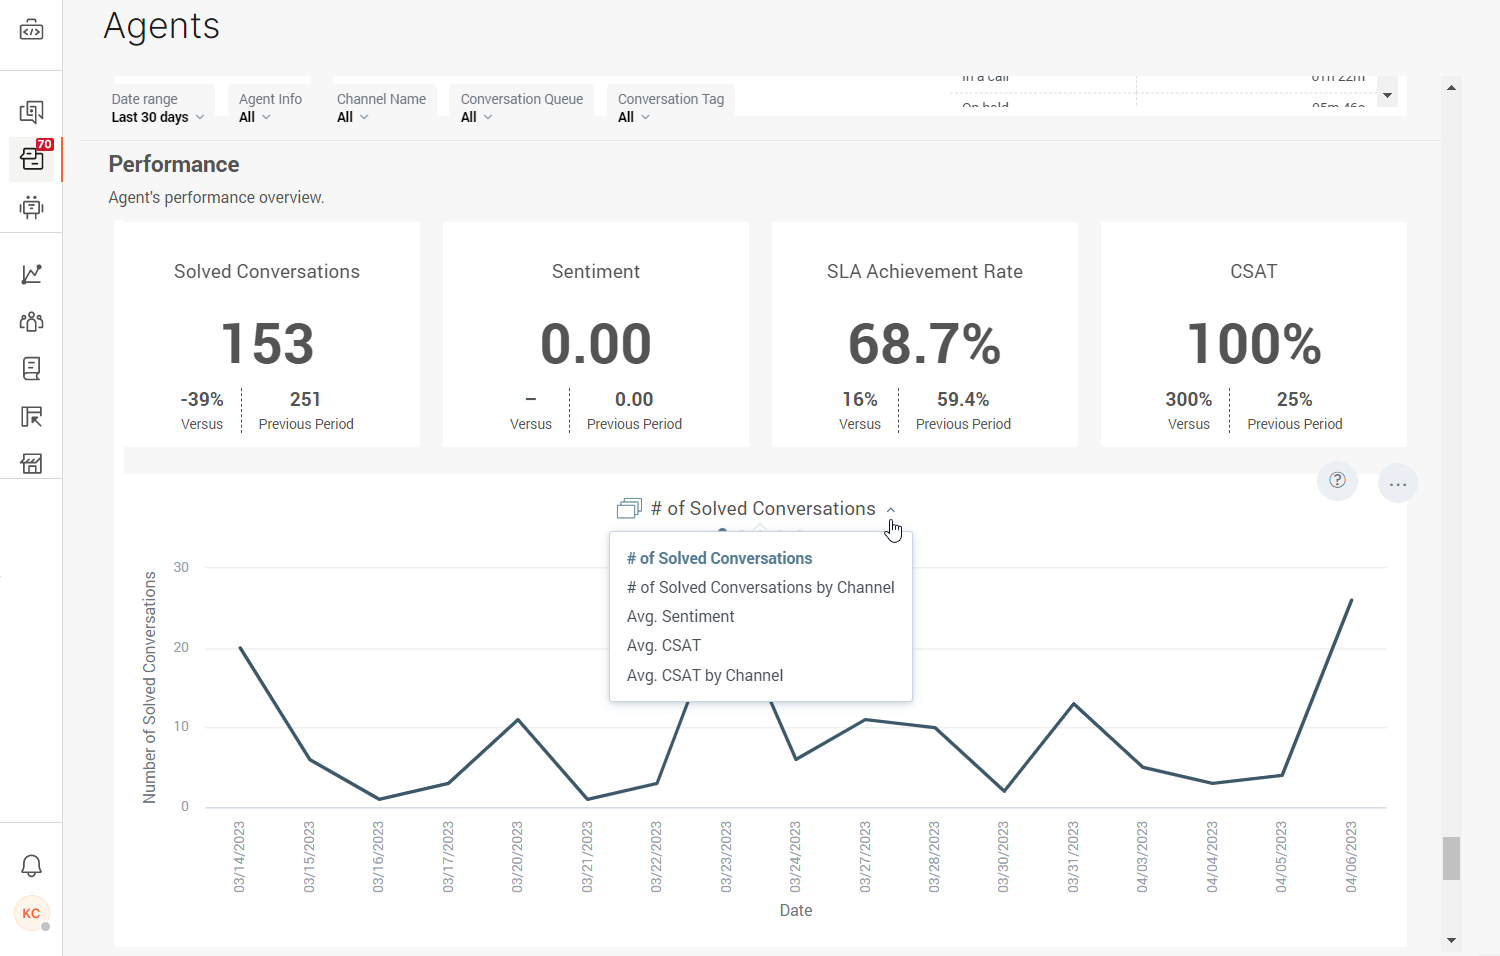
Performance
This metric provides an overview of your agents' performance:
- Solved Conversations shows all conversations marked as solved or closed in the selected time range and filter criteria.
- Sentiment shows the median sentiment score in conversations handed by the selected agent(s).
- SLA Achievement Rate outlines the percentage of conversations that fulfilled their service-level agreement.
- CSAT displays the percentage of positive survey responses.
Dive deeper into these metrics and check out the graph below which you can use to view:
- The number of solved conversations
- The number of solved conversations by channel
- Average sentiment
- Average CSAT
- Average CSAT by channel
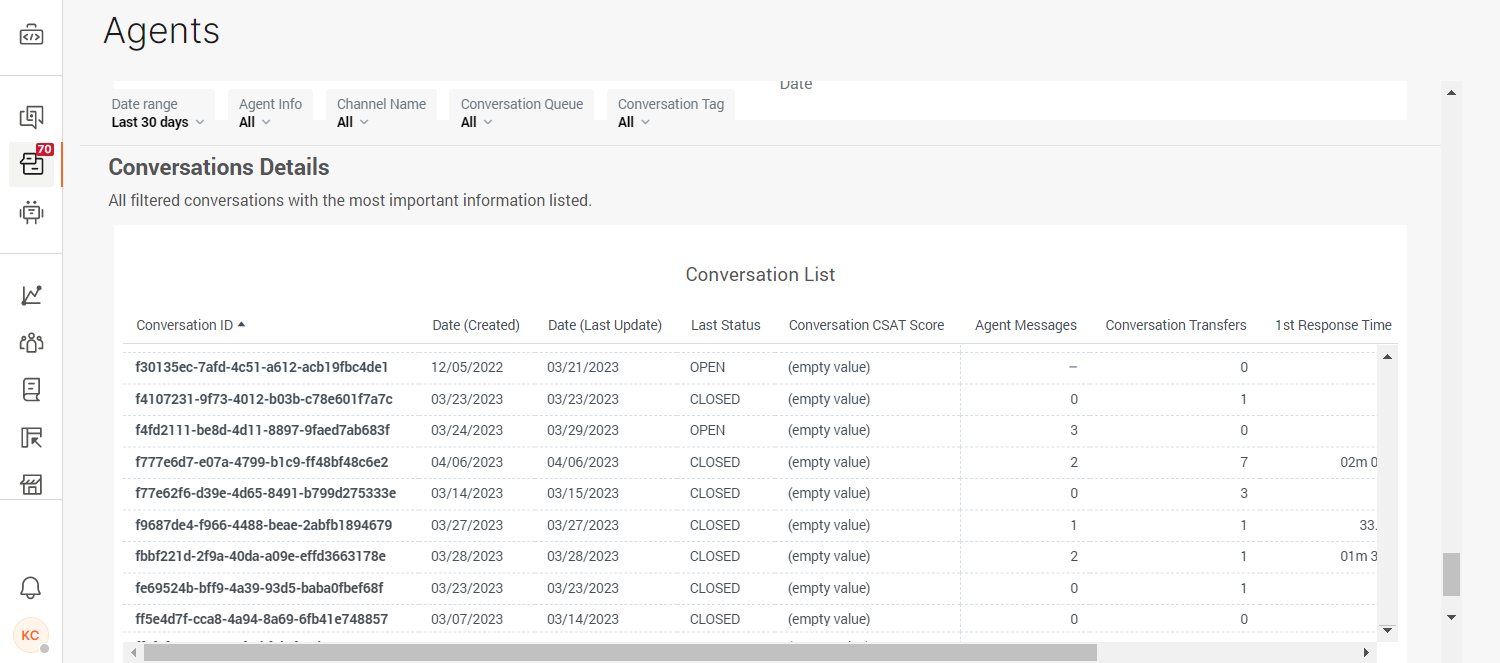
Conversations Details
All filtered conversations with the most important information listed. This is a list of all conversations that meet your search criteria.
Click on any of the Conversation IDs to go to that specific conversation in the All Work panel.
Conversations
Dive deeper into details about all conversations in your contact center.
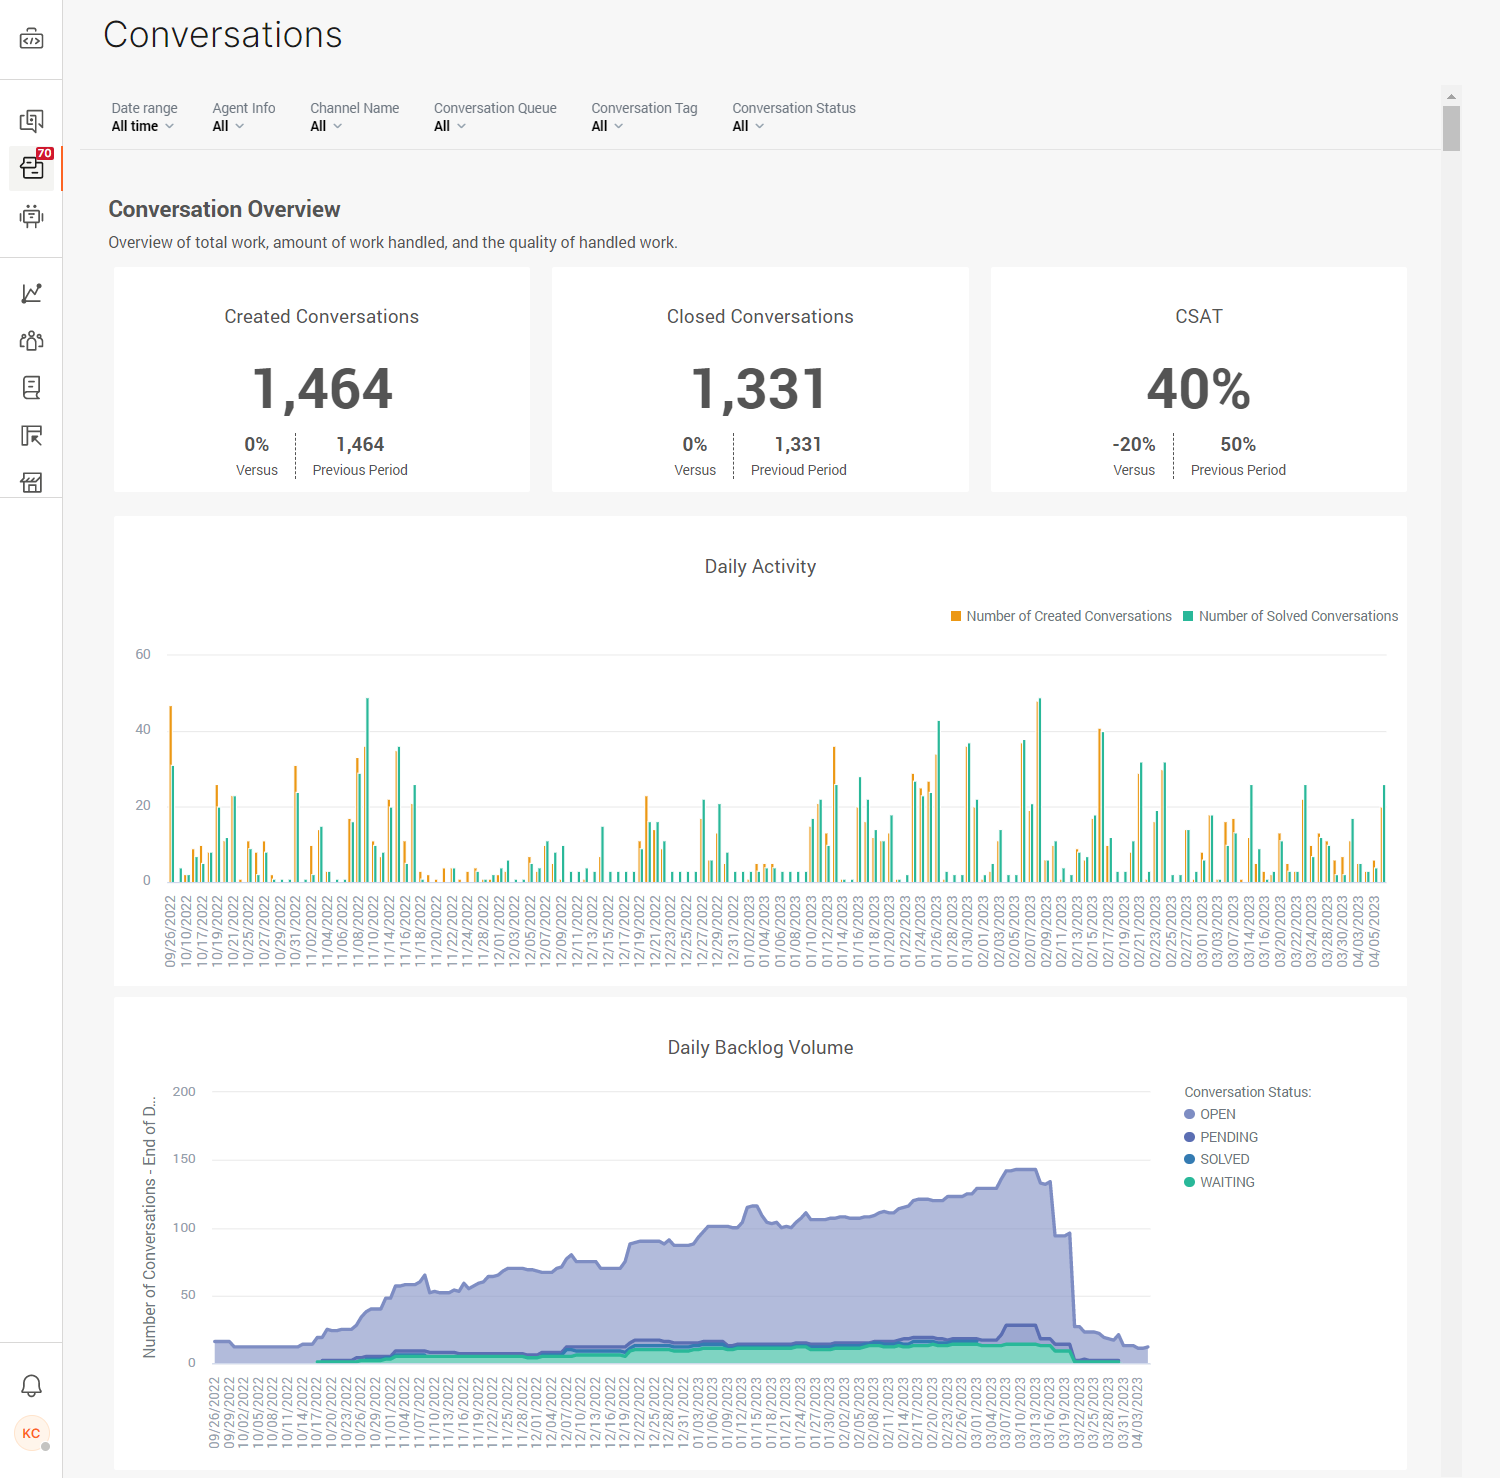
Conversation Overview
Overview of total work, amount of work handled, and the quality of handled work:
- Created Conversations are all conversations created in the selected time range that meet your filter criteria.
- Closed Conversations are all conversations marked as Solved or Closed in the selected time range that meet your filter criteria.
- CSAT is the percentage of positive survey responses.
- Daily Activity graph displays the number of created and solved conversations for the past 30 days.
- Daily Backlog Volume graph displays the number of tickets per day that are in the backlog. This graph updates automatically at the end of each day. Here you will see the Open, Waiting, and Solved number of tickets, and all are turned on by default. Click on any of them to exclude this data from the graph.
Tags, Queues , and Channels
Get an insight into the most frequently used tags and how queues and channels are performing. These graphs display conversations by tags, the number of conversations per queue, and the number of conversations per each channel.
The graph will display a bigger square for those items with a higher frequency of usage.
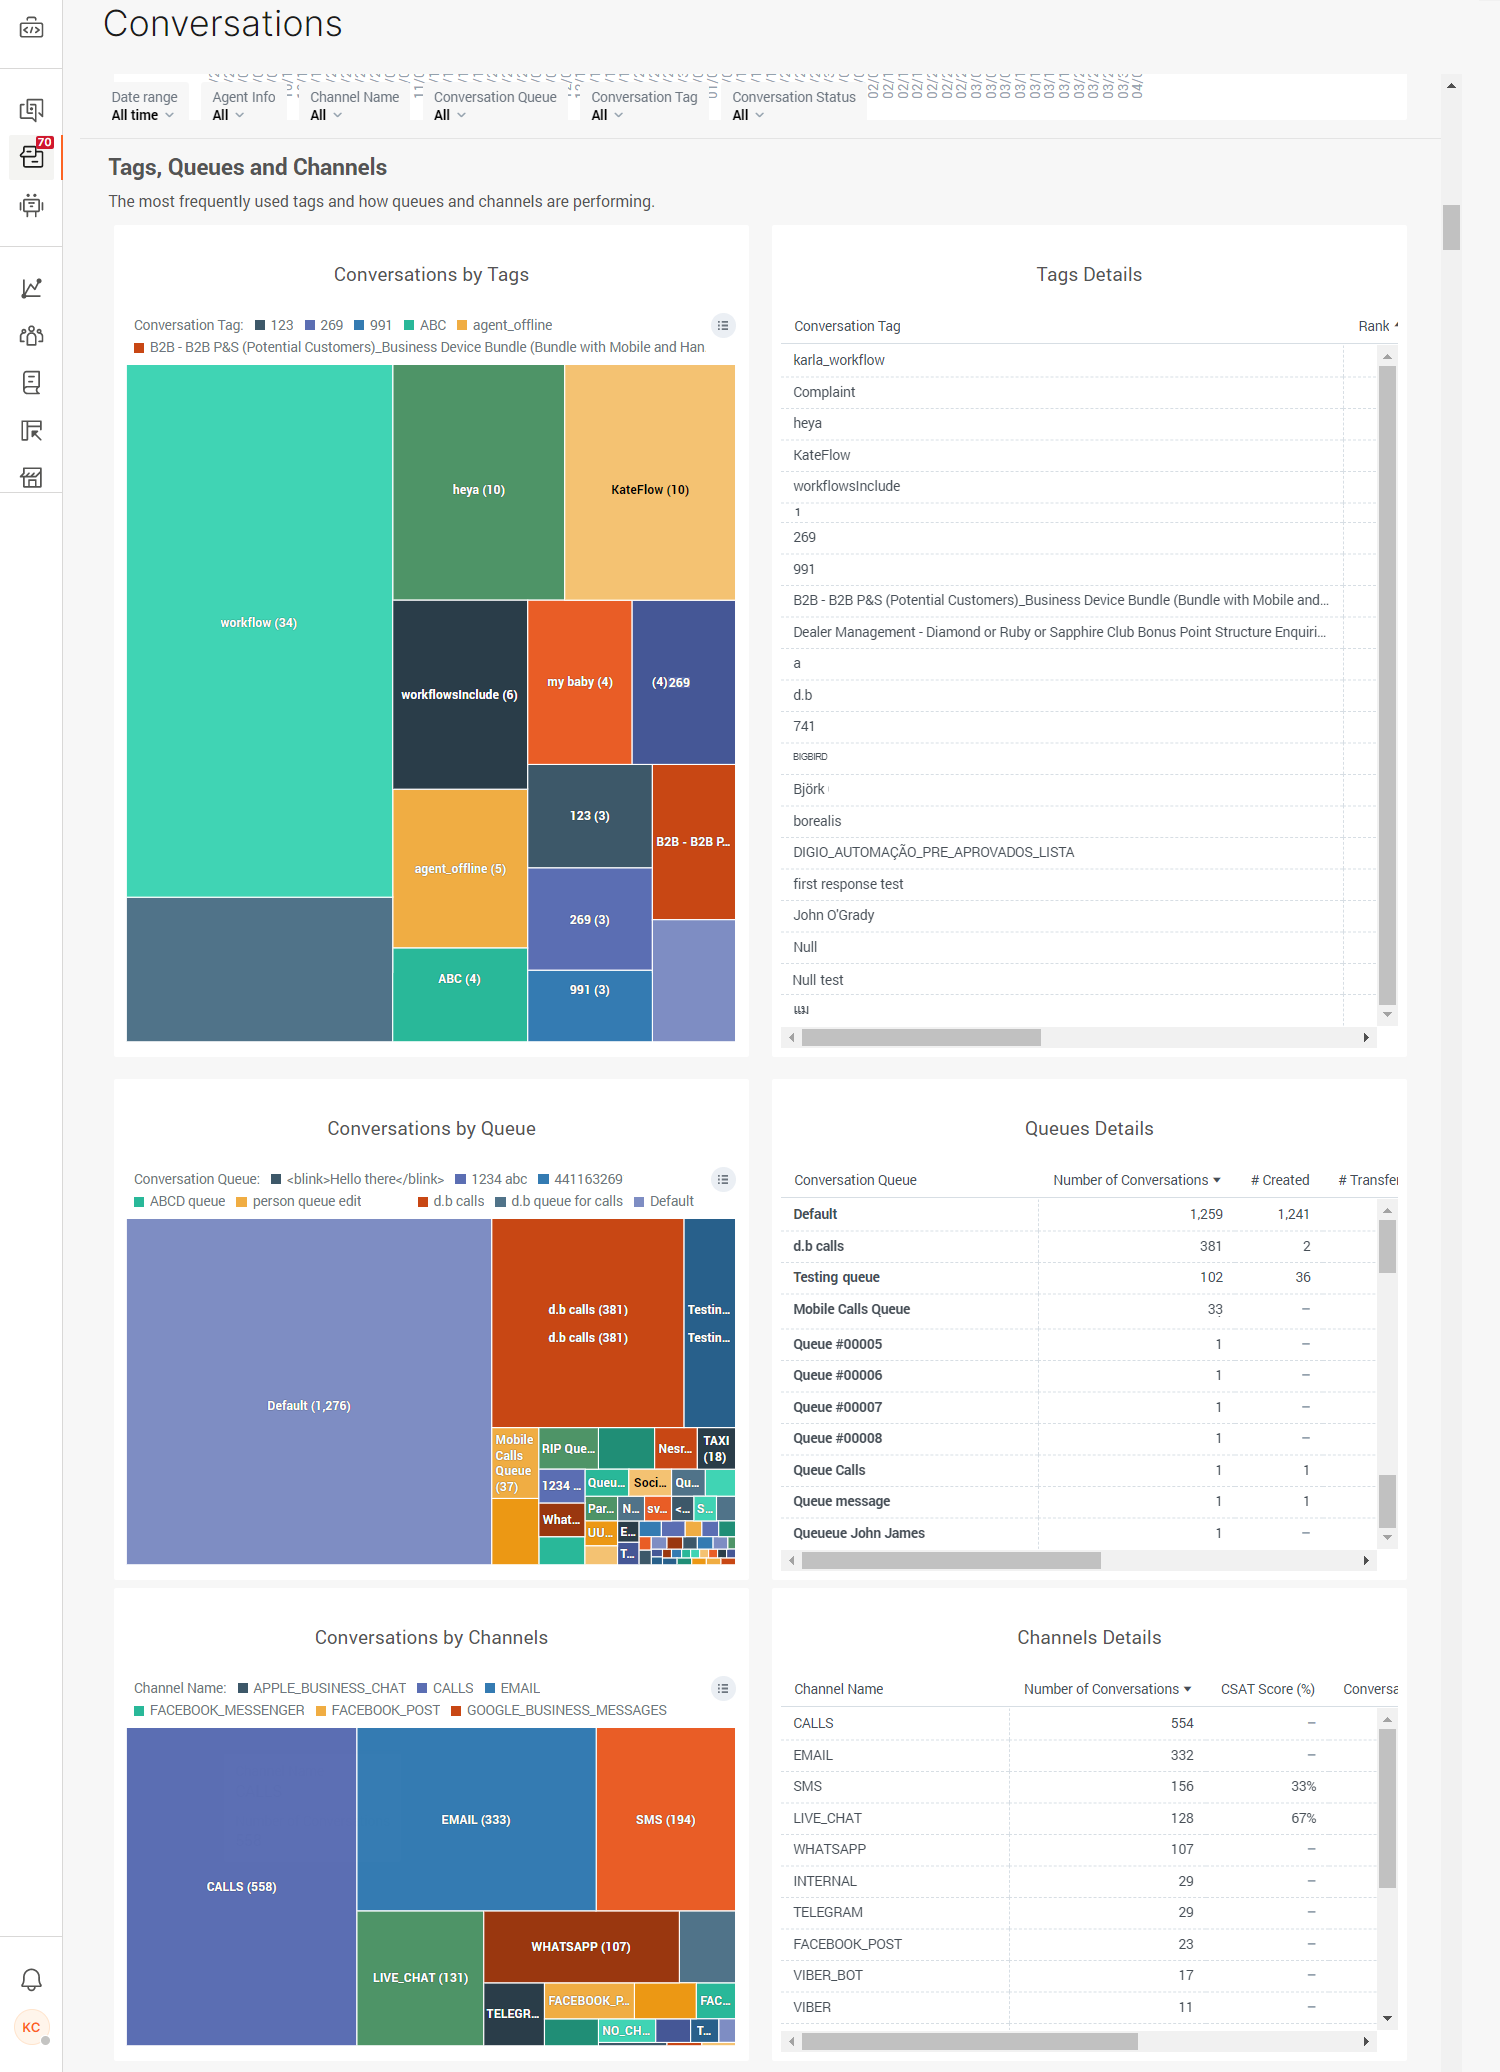
Play around with the graphs and explore insights further, or export the report by clicking on the three-dot button and selecting one of the export options.
On the right side of this section, you can see more details for tags, queues, and channels.
Conversations Distribution Details
This section offers more info regarding the distribution of conversations based on important indicators such as wait time and CSAT score.
- Conversations by Number of messages represents the number of times an agent replied in a conversation (a single touch denotes one reply from an agent).
- CSAT Distribution displays how many conversations had a customer satisfaction survey sent.
- Waiting time distribution shows the average waiting times for conversations per each hour of the day.
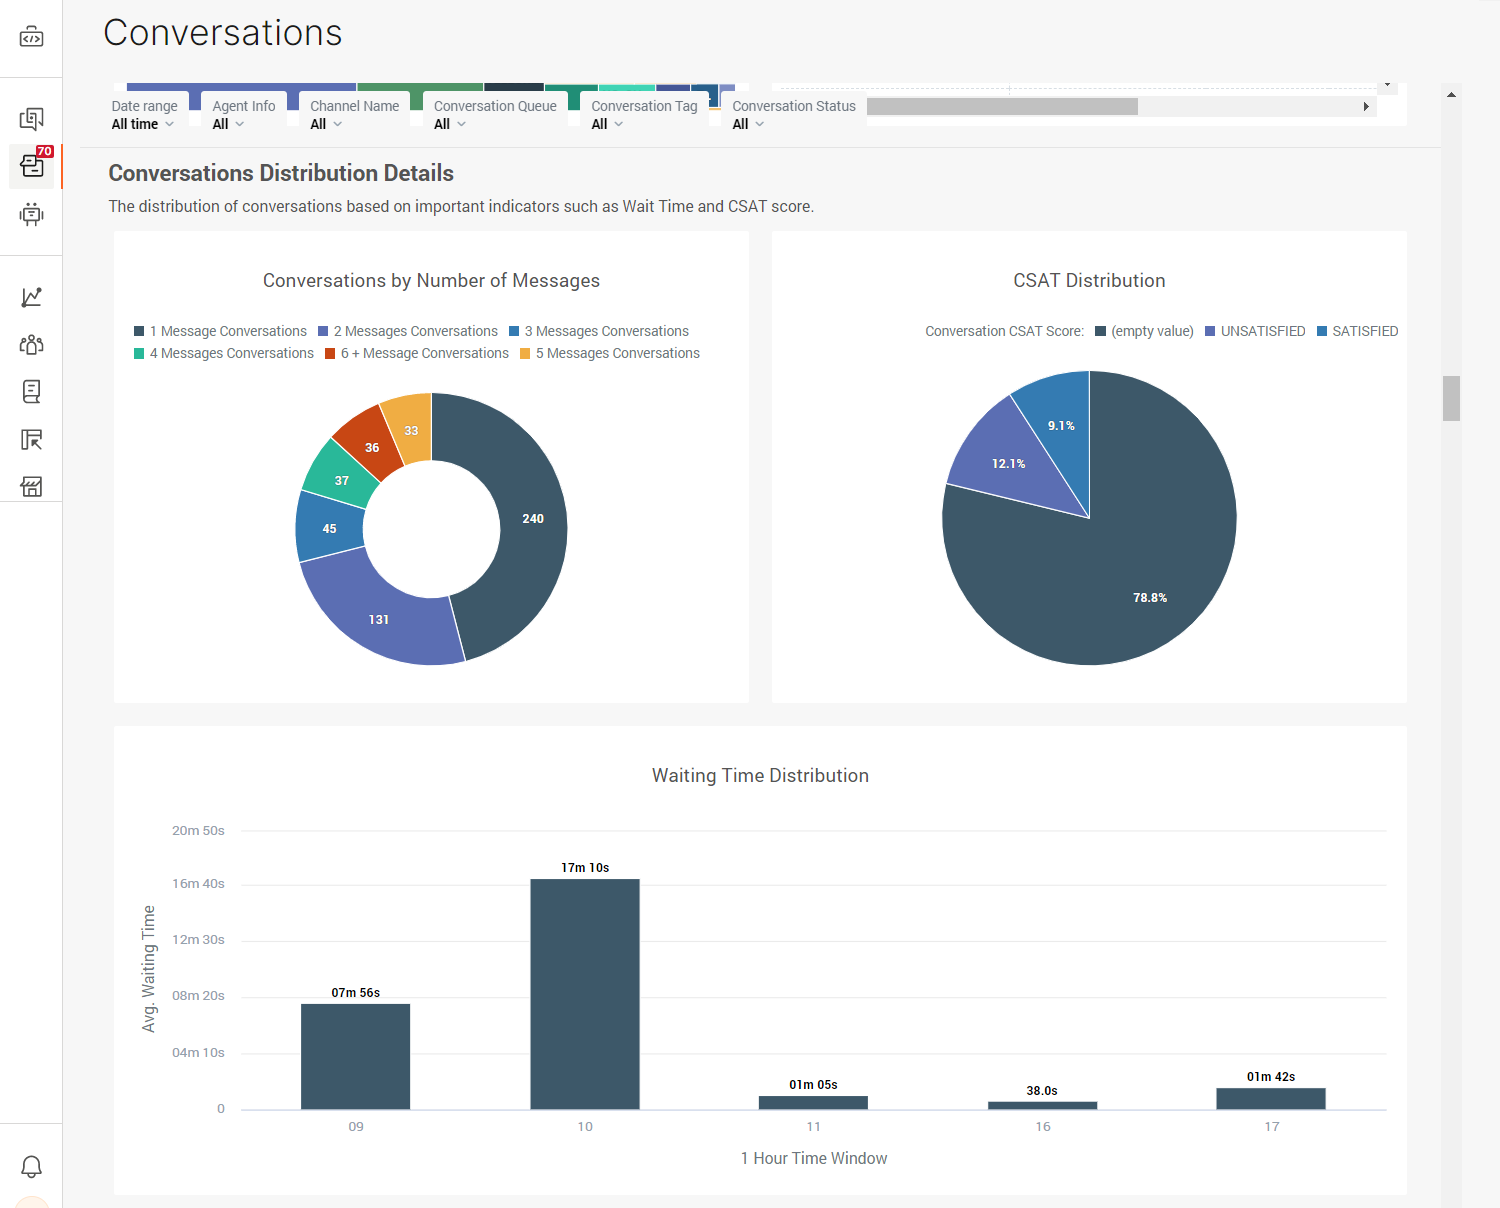
Waiting time refers to the time that a conversation spent in the WAITING status.
Conversations Timing Distribution
Shows when most of your conversations happen. This section helps you determine the busiest days and recognize peak times. This graph shows the most popular days (in terms of the number of conversations created on that day).
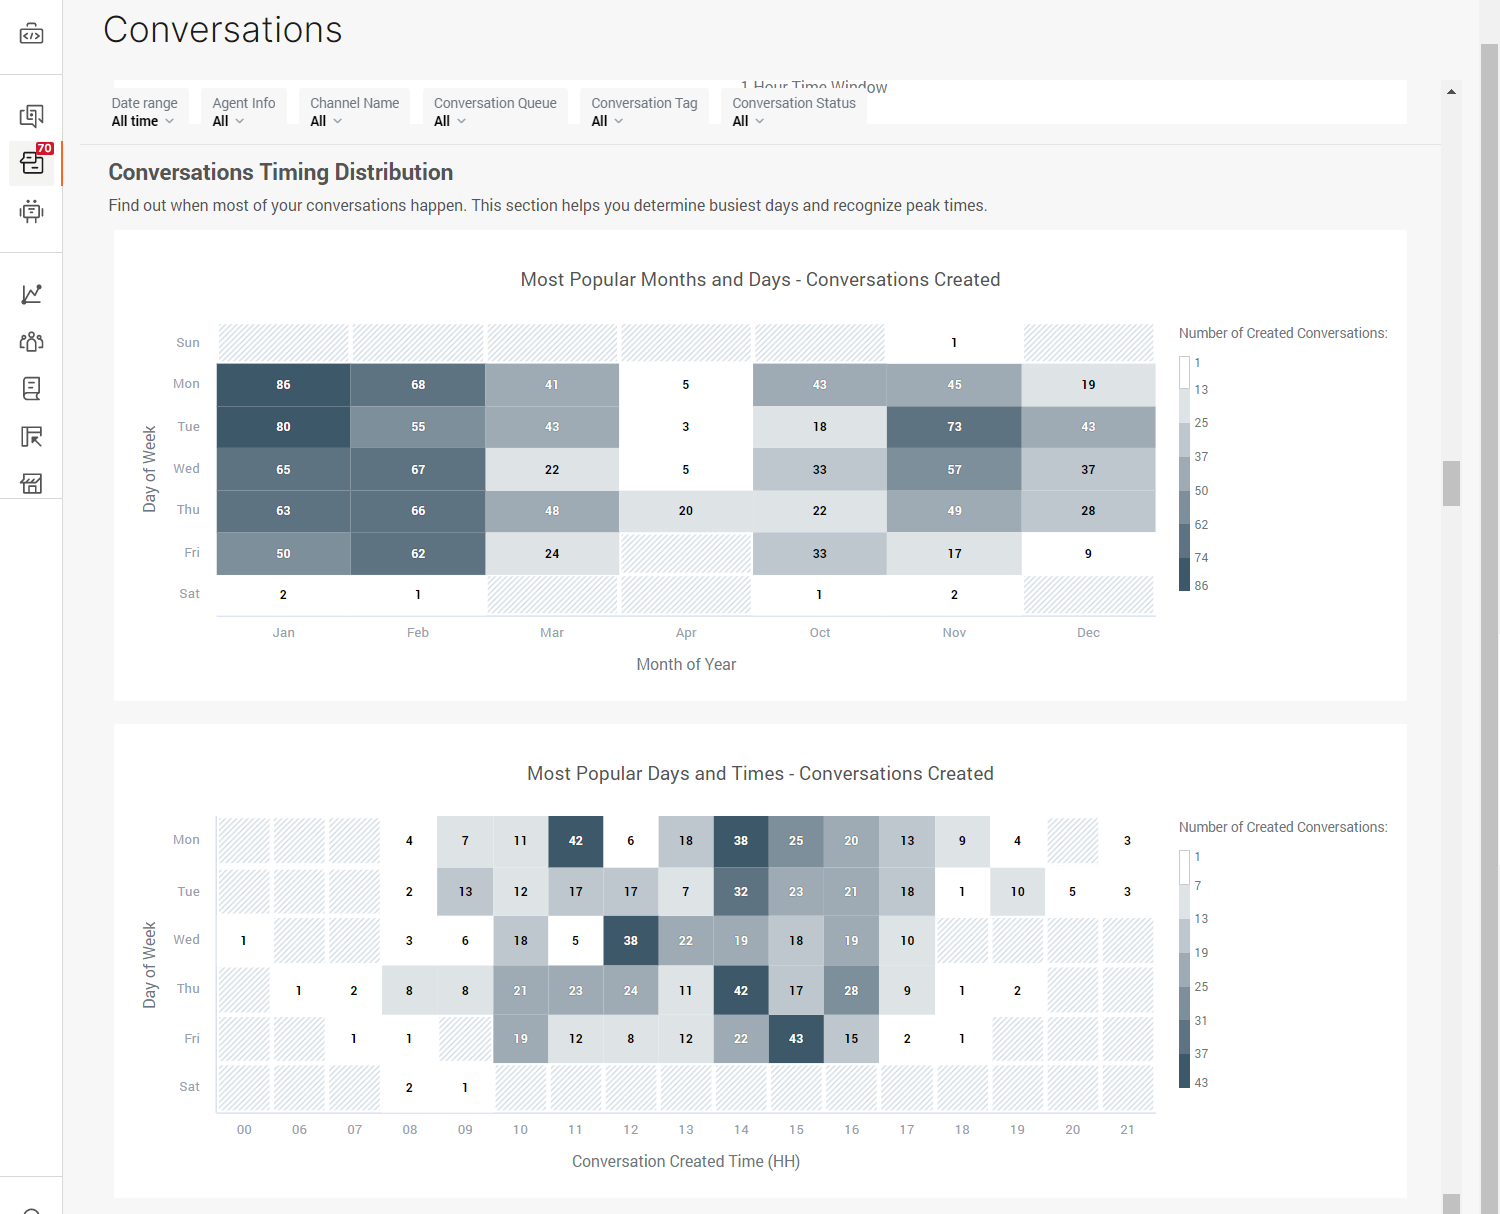
Below this graph, you can also check out the number of created conversations per every hour of every day of the week.
Conversations details
All filtered conversations with the most important information listed. This is a list of all conversations that meet your search criteria.
Click on any of the Conversations IDs to go to that specific conversation in the All Work panel.
Voice of the customer
All of the analytics gathered do not mean much without the user feedback and CSAT helps you obtain that feedback, and analyze it to determine if you need to make any changes in your contact center.
Besides analytics and reports that you can get from these pages, use the customer satisfaction survey to gather data directly from the users themselves. Allowing users to engage with a CSAT survey is the quickest way to find out if the service you are providing to your customers is satisfactory or if you need to work on improving it.
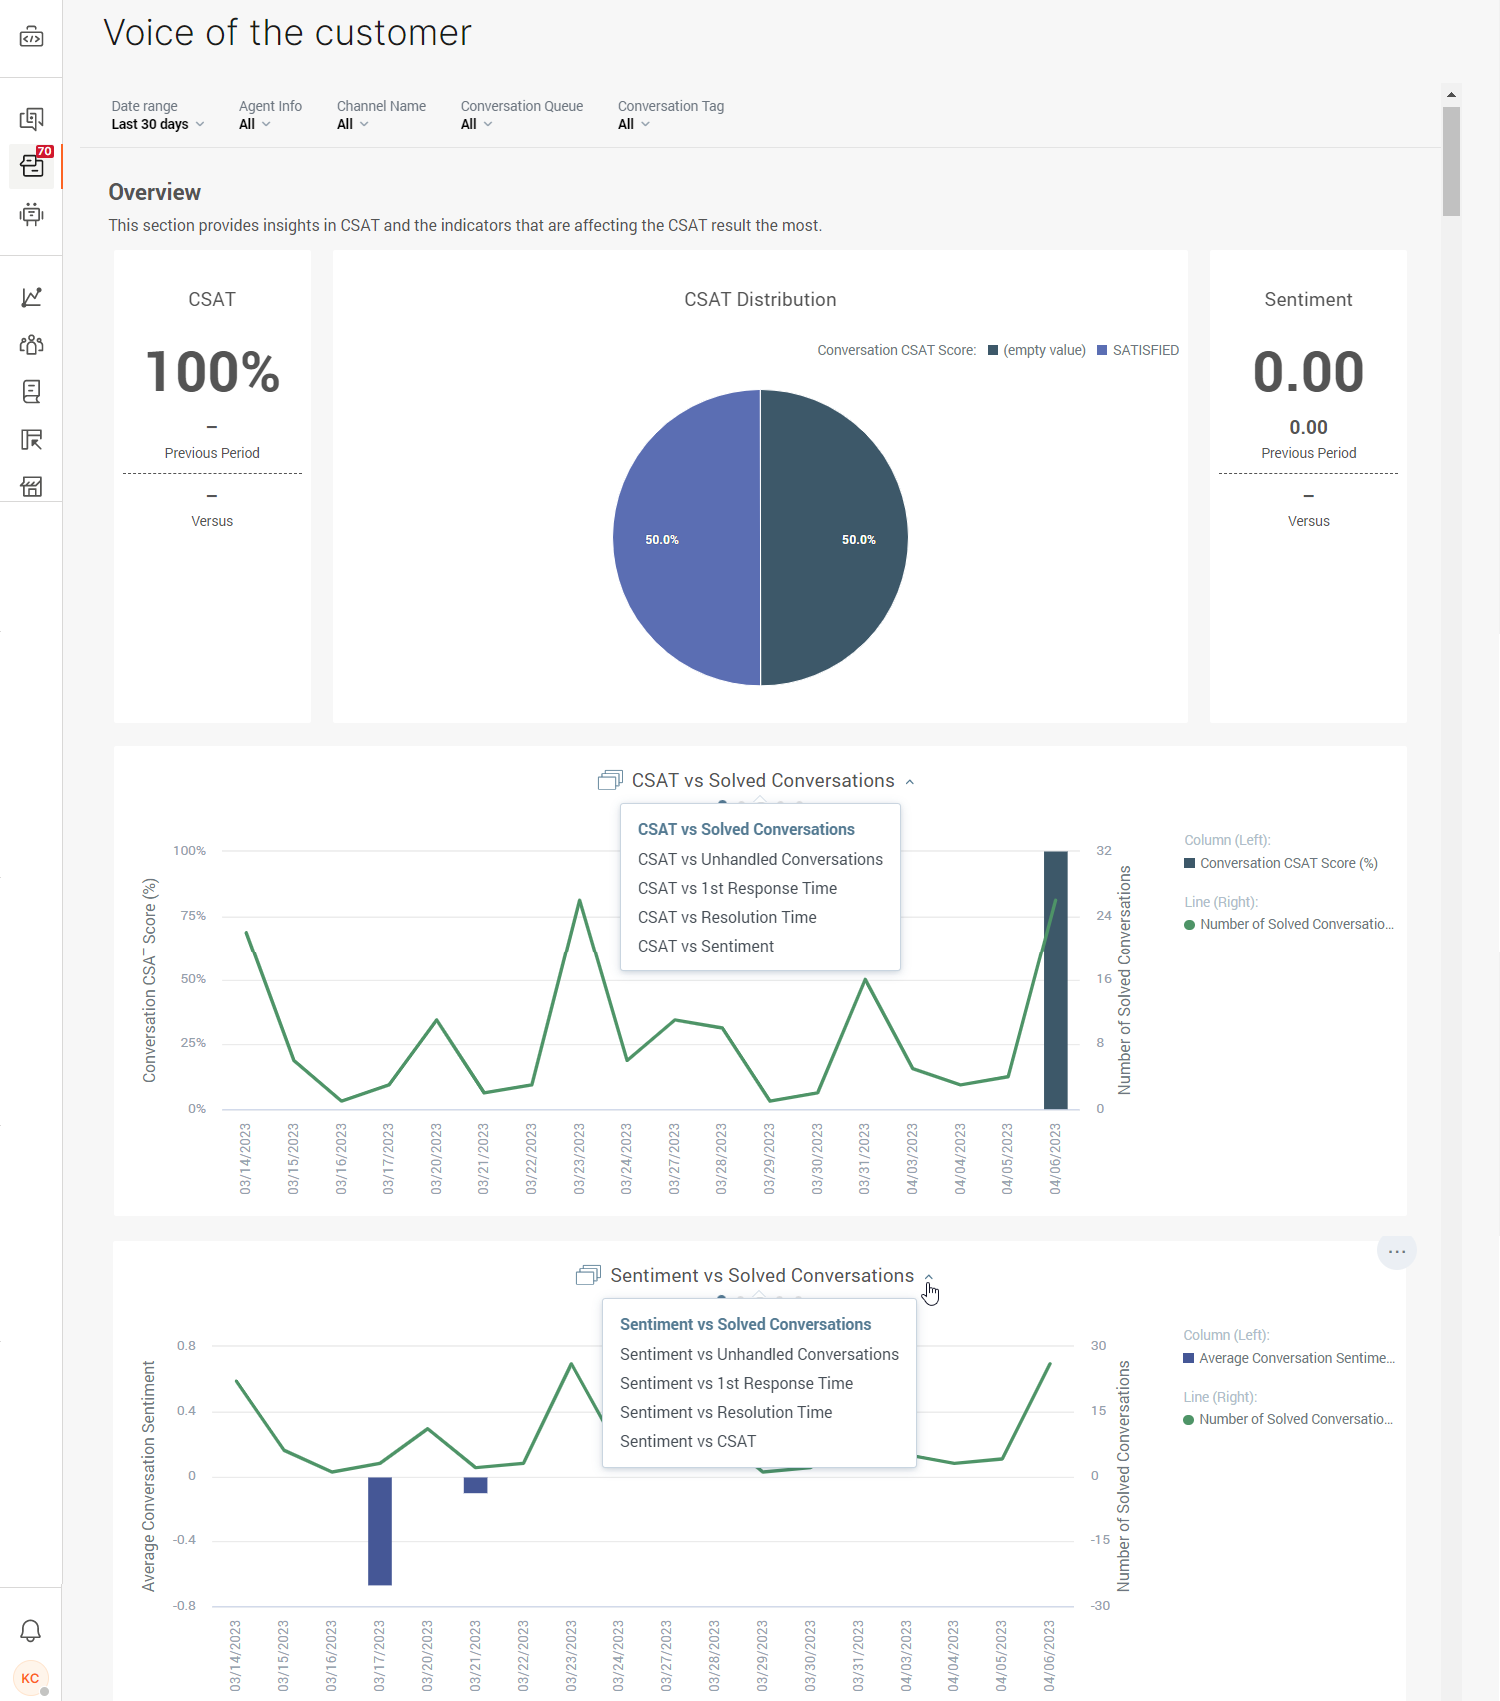
Overview
This section provides insights into customer satisfaction and the indicators that are affecting the CSAT result the most. Here you can see the CSAT score (based on percentage), the distribution of CSAT in conversations, and the median sentiment score.
If you wish to go into detail, check out the two graphs below the overview that showcase the CSAT about other important metrics + sentiment in relation to other important metrics.
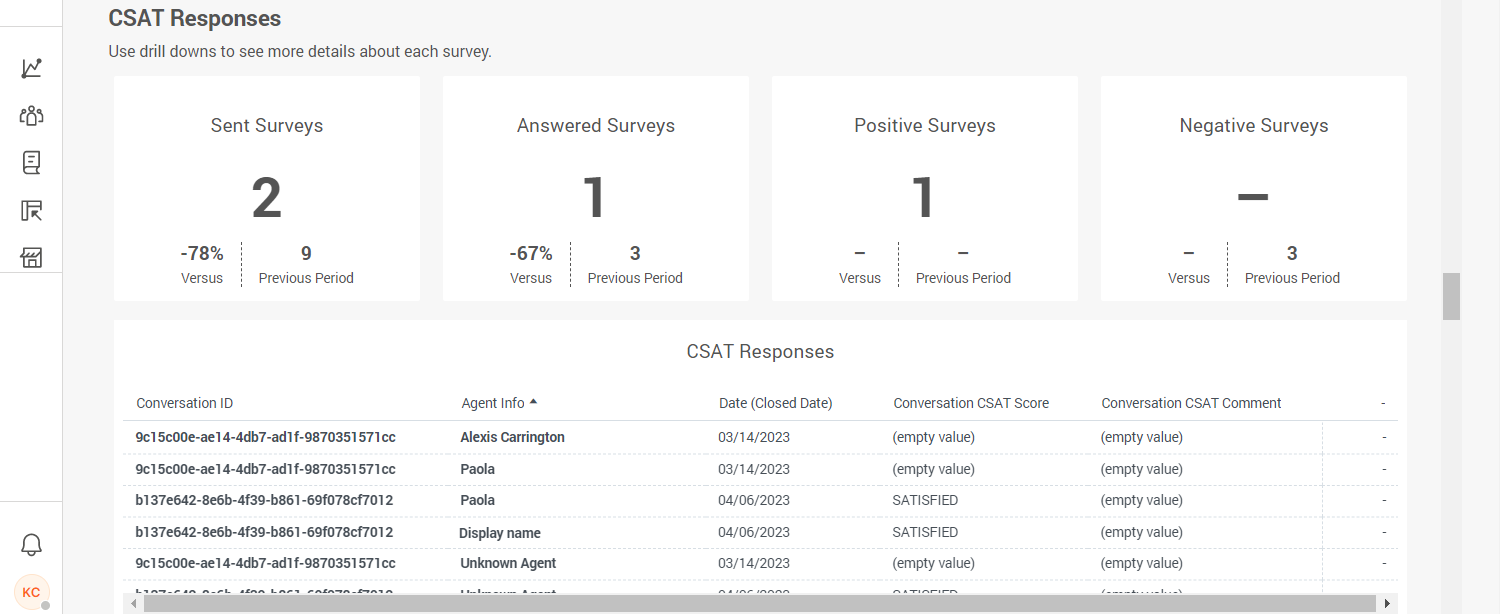
CSAT Responses
The very last insight on this page shows a list of all survey responses:
- Sent surveys shows the total number of surveys sent to the customers.
- Answered surveys shows all responses from the customers.
- Positive surveys shows the total number of positive responses by the customers.
- Negative surveys shows the total number of negative responses by the customers.
Click on any of the conversation IDs to see full conversation details. Besides the conversation IDs, here you can see the agent who handled that particular conversation, the date the survey was closed, the CSAT score, and comments if there are any for that particular conversation.